
TL;DR
Use xaxis.fixedrange=True or yaxis.fixedrange=True to disable zooming and panning on a specific axis, while leaving the other axis interactive.
fig.update_xaxes(fixedrange=True)
fig.update_yaxes(fixedrange=False)
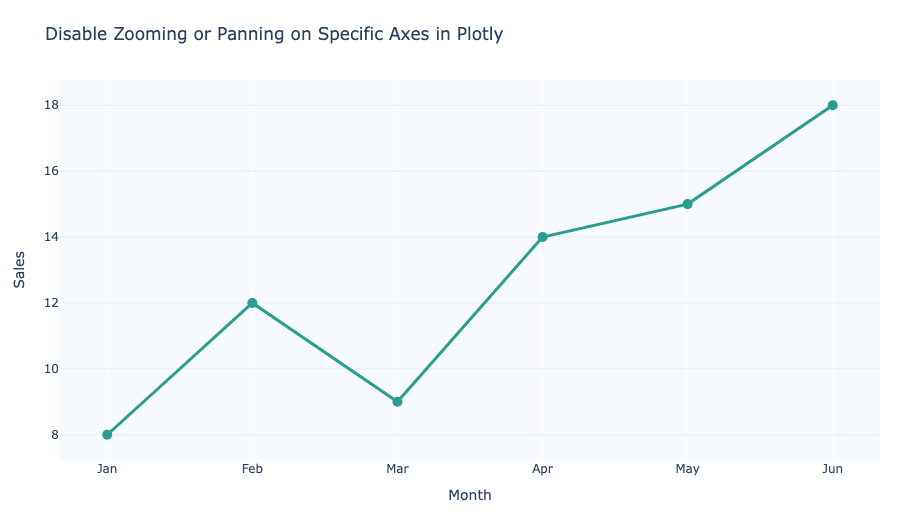
Disable zoom on a single axis
Plotly uses fixedrange=True to lock an axis so users cannot zoom or pan it. This is useful when one axis should stay fixed while the other stays interactive.
fig.update_xaxes(fixedrange=True)
fig.update_yaxes(fixedrange=False)
This disables zooming/panning on the x-axis but leaves the y-axis free.
Disable panning and zooming on the y-axis instead
To keep the x-axis interactive while fixing the y-axis, swap the axis settings.
fig.update_xaxes(fixedrange=False)
fig.update_yaxes(fixedrange=True)
Use dragmode with fixed axes
If you want to highlight selection tools, set dragmode='zoom' or dragmode='pan' and then lock only the target axis.
fig.update_layout(dragmode='zoom')
fig.update_xaxes(fixedrange=True)
fig.update_yaxes(fixedrange=False)
This keeps trackpad or mouse drag behavior consistent while preventing one axis from changing scale.
Disable the modebar zoom buttons
You can also hide the modebar buttons entirely for a cleaner experience.
fig.show(config=dict(displayModeBar=False))
When to use fixed axes
Use fixedrange when:
- you want a stable time axis but still allow value zooming,
- you want to preserve proportional width while inspecting vertical values,
- you need consistent comparison across charts.
Summary
xaxis.fixedrange=Truelocks the x-axis.yaxis.fixedrange=Truelocks the y-axis.- Use
dragmodeto choose the interaction type. - Fixed axes keep chart behavior predictable while still allowing partial user interaction.