
TL;DR
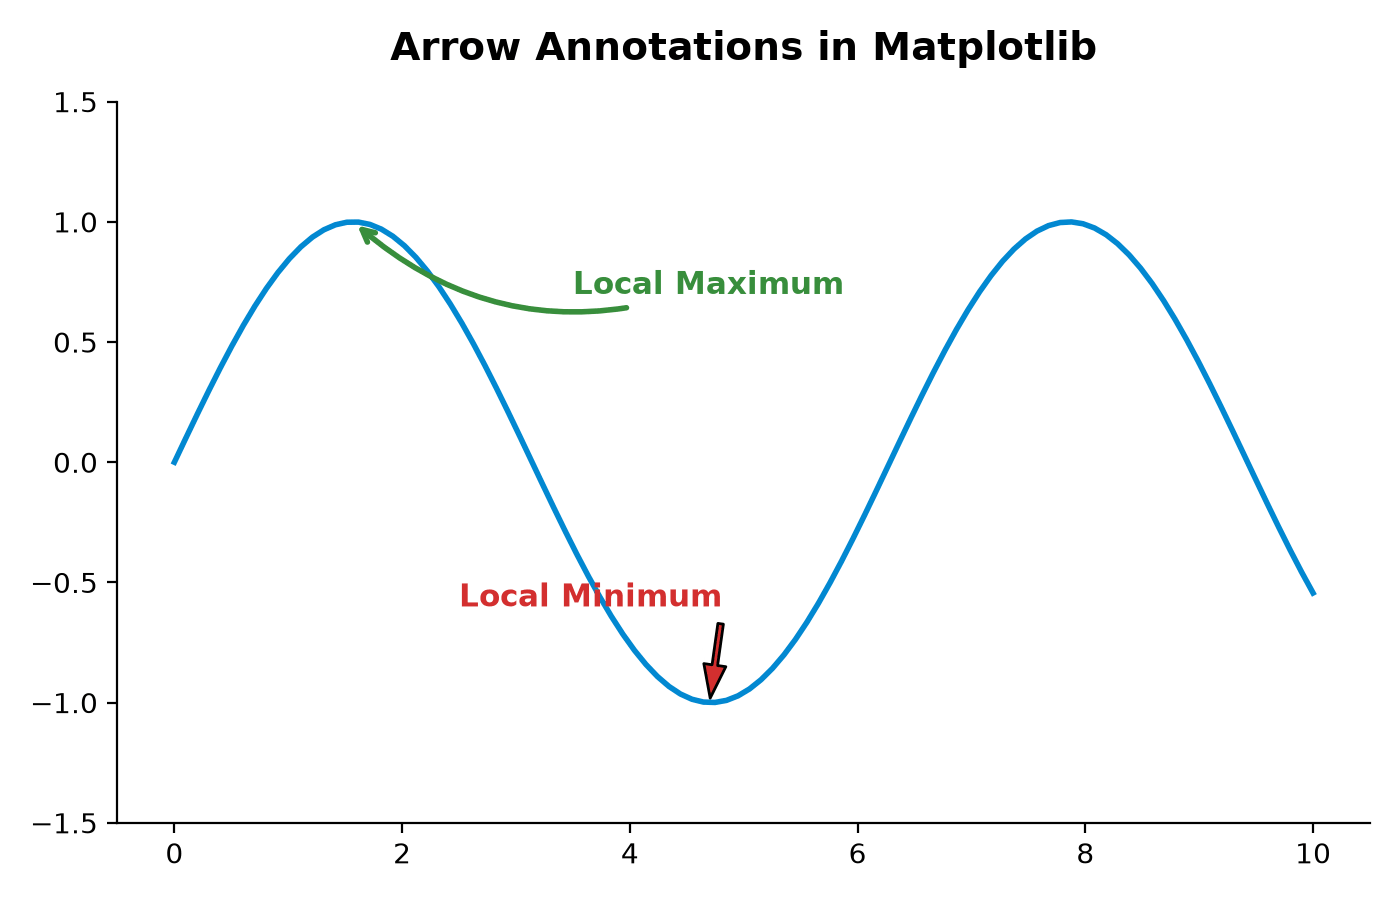
Configure the arrowprops dictionary in ax.annotate() to add callout arrows pointing to a data point. Use arrowstyle for simple line-art arrows, or define properties like width and headwidth to draw solid block arrows.
import matplotlib.pyplot as plt

fig, ax = plt.subplots(figsize=(7, 4.5))
ax.plot(x, y)

# 1. Block arrow (using width, headwidth, facecolor)
ax.annotate(
    'Local Minimum',
    xy=(4.7, -1),                         # Target coordinate
    xytext=(2.5, -0.6),                   # Text coordinate
    arrowprops=dict(facecolor='red', shrink=0.05, width=2, headwidth=8)
)

# 2. Curved line arrow (using arrowstyle and connectionstyle)
ax.annotate(
    'Local Maximum',
    xy=(1.57, 1),
    xytext=(3.5, 0.7),
    arrowprops=dict(arrowstyle='->', connectionstyle='arc3,rad=-0.3', color='green')
)

plt.show()
The arrowprops Parameter
The arrowprops parameter in ax.annotate() accepts a dictionary containing properties that dictate how the arrow connecting the text label (xytext) to the target coordinate (xy) is drawn.
There are two primary modes to configure arrowprops:
1. FancyArrowPatch Mode: Configured by setting the arrowstyle key.
2. Y-Arrow Mode: Configured by specifying individual geometry properties like width, headwidth, and facecolor (no arrowstyle key).
Method 1: Creating Block Arrows
To create thick, solid block arrows, omit arrowstyle and define the shape geometry properties inside arrowprops:
width: The width of the arrow tail stem in points.headwidth: The width of the base of the arrow head in points.headlength: The length of the arrow head in points.shrink: Moves the arrow tip and tail slightly away from the target coordinates to prevent overlaps. A value of0.05shrinks the arrow by 5% at both ends.facecolor: The color of the arrow fill.
Example:
ax.annotate(
    'Target Point',
    xy=(5, 10),
    xytext=(3, 8),
    arrowprops=dict(
        facecolor='darkblue',
        shrink=0.05,
        width=3,
        headwidth=10,
        headlength=8
    )
)
Method 2: Creating Line Arrows (with Styles)
To draw sleek, line-art arrows, set the arrowstyle key. Once arrowstyle is set, properties like width or headwidth are ignored.
Common arrowstyle directives include:
- '- >' (standard line arrow)
- '- [ >' (bracketed arrow tail)
- 'fancy' (curved shape)
- 'simple' (basic arrow shape)
Example:
ax.annotate(
    'Feature',
    xy=(5, 10),
    xytext=(3, 8),
    arrowprops=dict(
        arrowstyle='->',
        color='darkgreen',
        linewidth=2
    )
)
Curving the Connection Line
By default, the connection line between the text label and target point is a straight line. To bend the line, specify connectionstyle inside the arrowprops dictionary.
The arc3 connection style accepts a rad (radius) value. A positive radius curves the line counter-clockwise, and a negative radius curves it clockwise:
# Curve the arrow to navigate around other markers or text
ax.annotate(
    'Label',
    xy=(5, 10),
    xytext=(3, 8),
    arrowprops=dict(
        arrowstyle='->',
        connectionstyle='arc3,rad=-0.3'
    )
)