
TL;DR
Use ax.set_xlim() and ax.set_ylim() after plotting. They set the visible range without changing your data.
import matplotlib.pyplot as plt

x = [0, 1, 2, 3, 4, 5, 6]
y = [2, 3, 5, 4, 7, 8, 6]

fig, ax = plt.subplots()
ax.plot(x, y, marker="o")

ax.set_xlim(1, 5)
ax.set_ylim(3, 9)

plt.show()
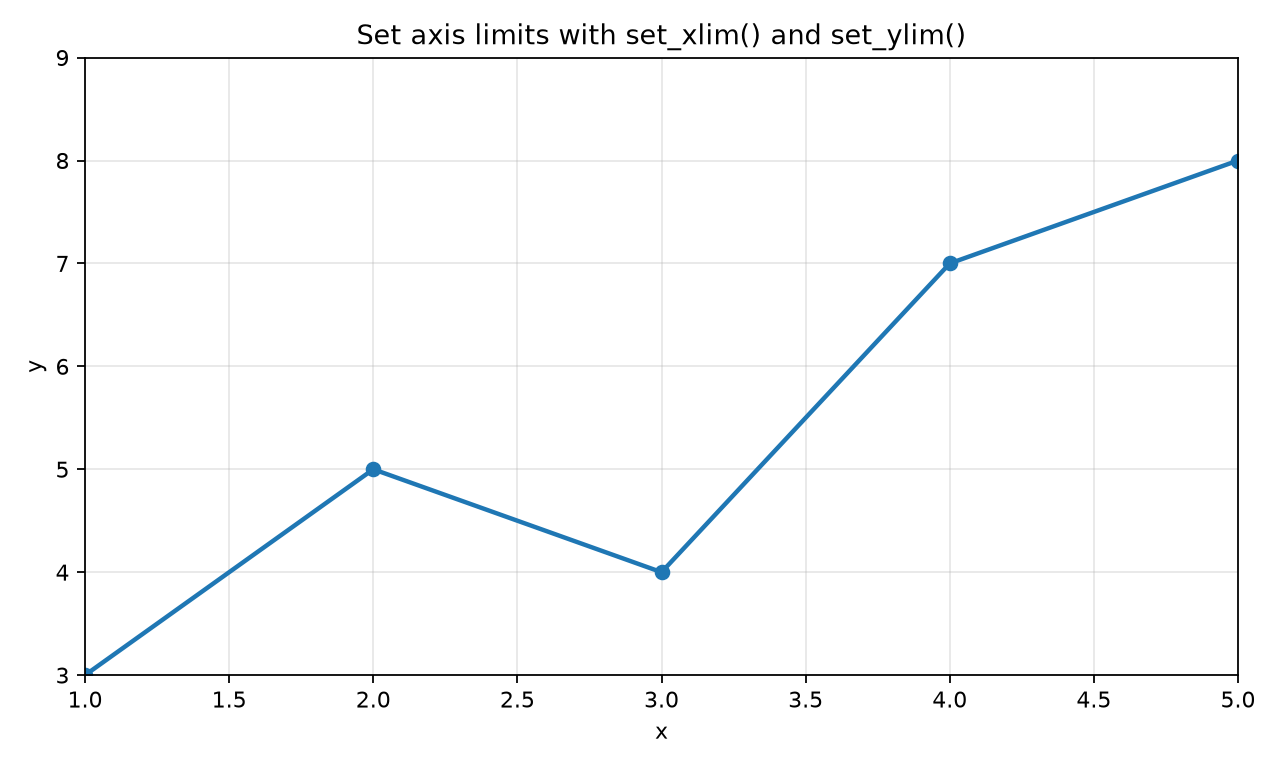
The points outside those limits are still in the data, but Matplotlib does not show them.
plt.xlim() and plt.ylim()
If you use Matplotlib's pyplot interface, the equivalent calls are plt.xlim() and plt.ylim():
plt.plot(x, y, marker="o")
plt.xlim(1, 5)
plt.ylim(3, 9)
plt.show()
The object-oriented ax.set_xlim() and ax.set_ylim() versions are usually easier to read, especially in figures with multiple subplots.
Set Only One Side
Pass None for a limit you want Matplotlib to choose automatically:
ax.set_xlim(left=0)       # Keep the automatic right limit
ax.set_ylim(top=10)       # Keep the automatic bottom limit
You can also reverse an axis by giving the limits in reverse order:
ax.set_xlim(10, 0)