
TL;DR
import matplotlib.pyplot as plt

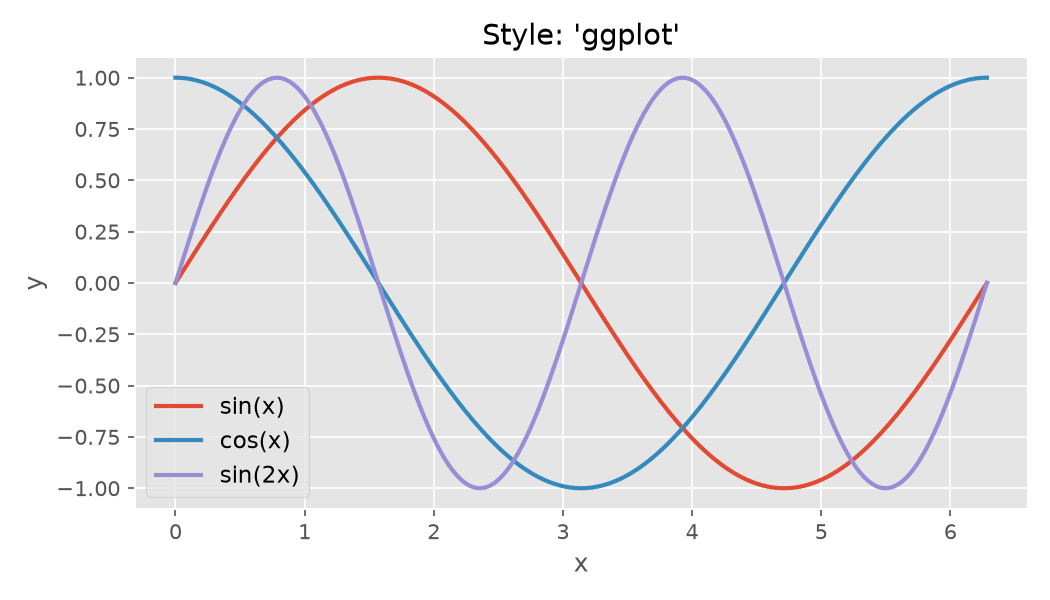
plt.style.use('ggplot')   # applies globally for the rest of the session

fig, ax = plt.subplots()
ax.plot([1, 2, 3], [4, 1, 3])
plt.show()
What style sheets do
A Matplotlib style sheet is a plain-text file (.mplstyle) that sets rcParams values — colors, fonts, line widths, grid settings, and more — in one go. Instead of configuring each element manually, you apply a style and every chart in that session inherits the look automatically.
Applying a style globally
plt.style.use() changes the style for every plot created after that point:
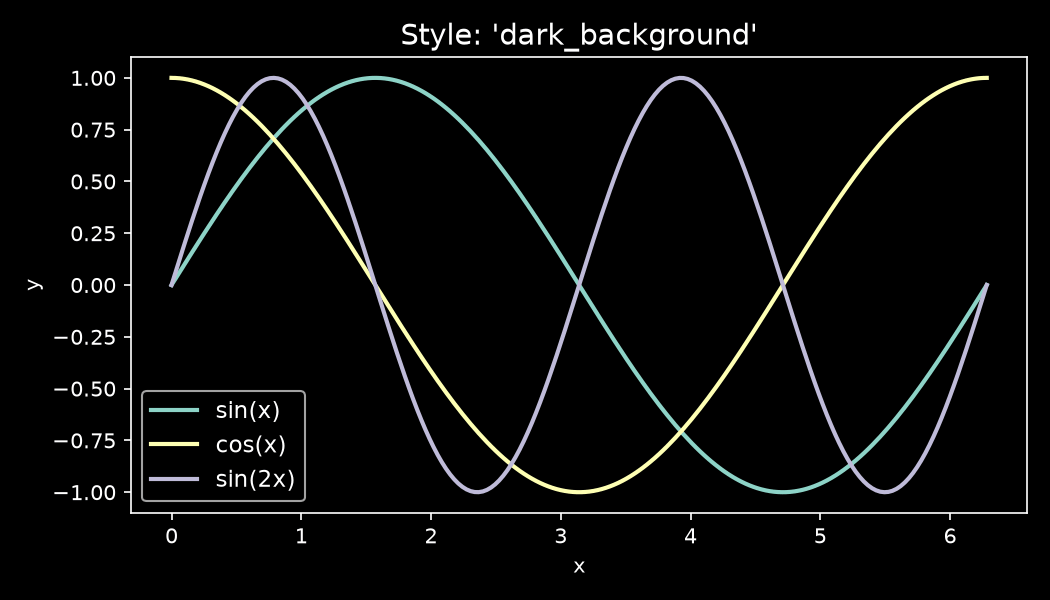
plt.style.use('dark_background')
Call it once at the top of your script or notebook. To reset to Matplotlib defaults, use plt.style.use('default').
Applying a style to one chart only
Use plt.style.context() as a context manager to scope the style to a single block without affecting anything else:
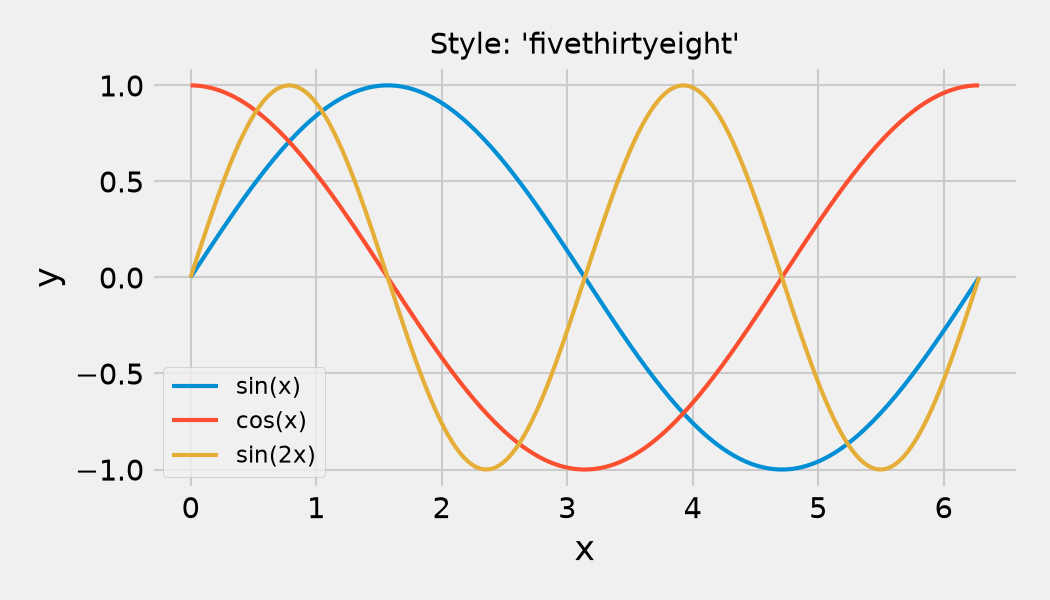
with plt.style.context('fivethirtyeight'):
    fig, ax = plt.subplots()
    ax.plot(x, y)
    plt.show()
This is the safer option in notebooks where you have multiple charts with different styles.
Listing all available styles
print(plt.style.available)
As of Matplotlib 3.9 the list includes around 30 styles. A few worth knowing:
| Style | Look |
|---|---|
default |
Matplotlib's baseline — white background, blue lines |
ggplot |
Grey grid, muted palette, inspired by R's ggplot2 |
dark_background |
Black background, bright lines |
fivethirtyeight |
Clean, minimal, grey grid — modelled on the FiveThirtyEight site |
seaborn-v0_8 |
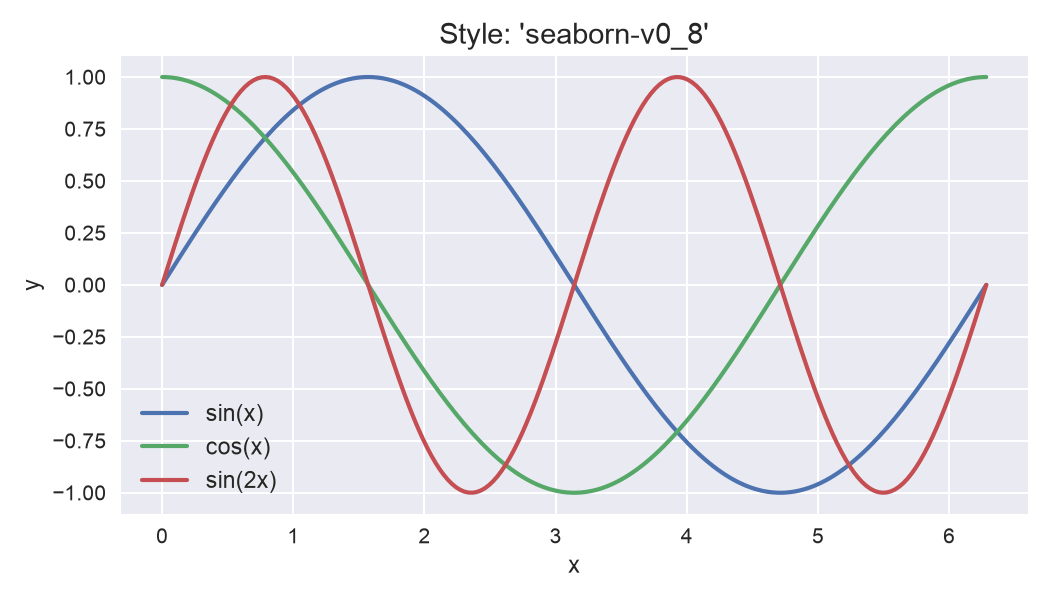
Seaborn's default aesthetic (use the v0_8 suffix in recent Matplotlib) |
bmh |
Bayesian Methods for Hackers palette |
Solarized_Light |
Solarized colour scheme |
tableau-colorblind10 |
Tableau's colorblind-accessible palette |
Combining styles
You can stack multiple styles by passing a list. Later styles override earlier ones for any keys they share:
plt.style.use(['dark_background', 'tableau-colorblind10'])
A common pattern is to apply a base layout style first, then a palette-only style on top.
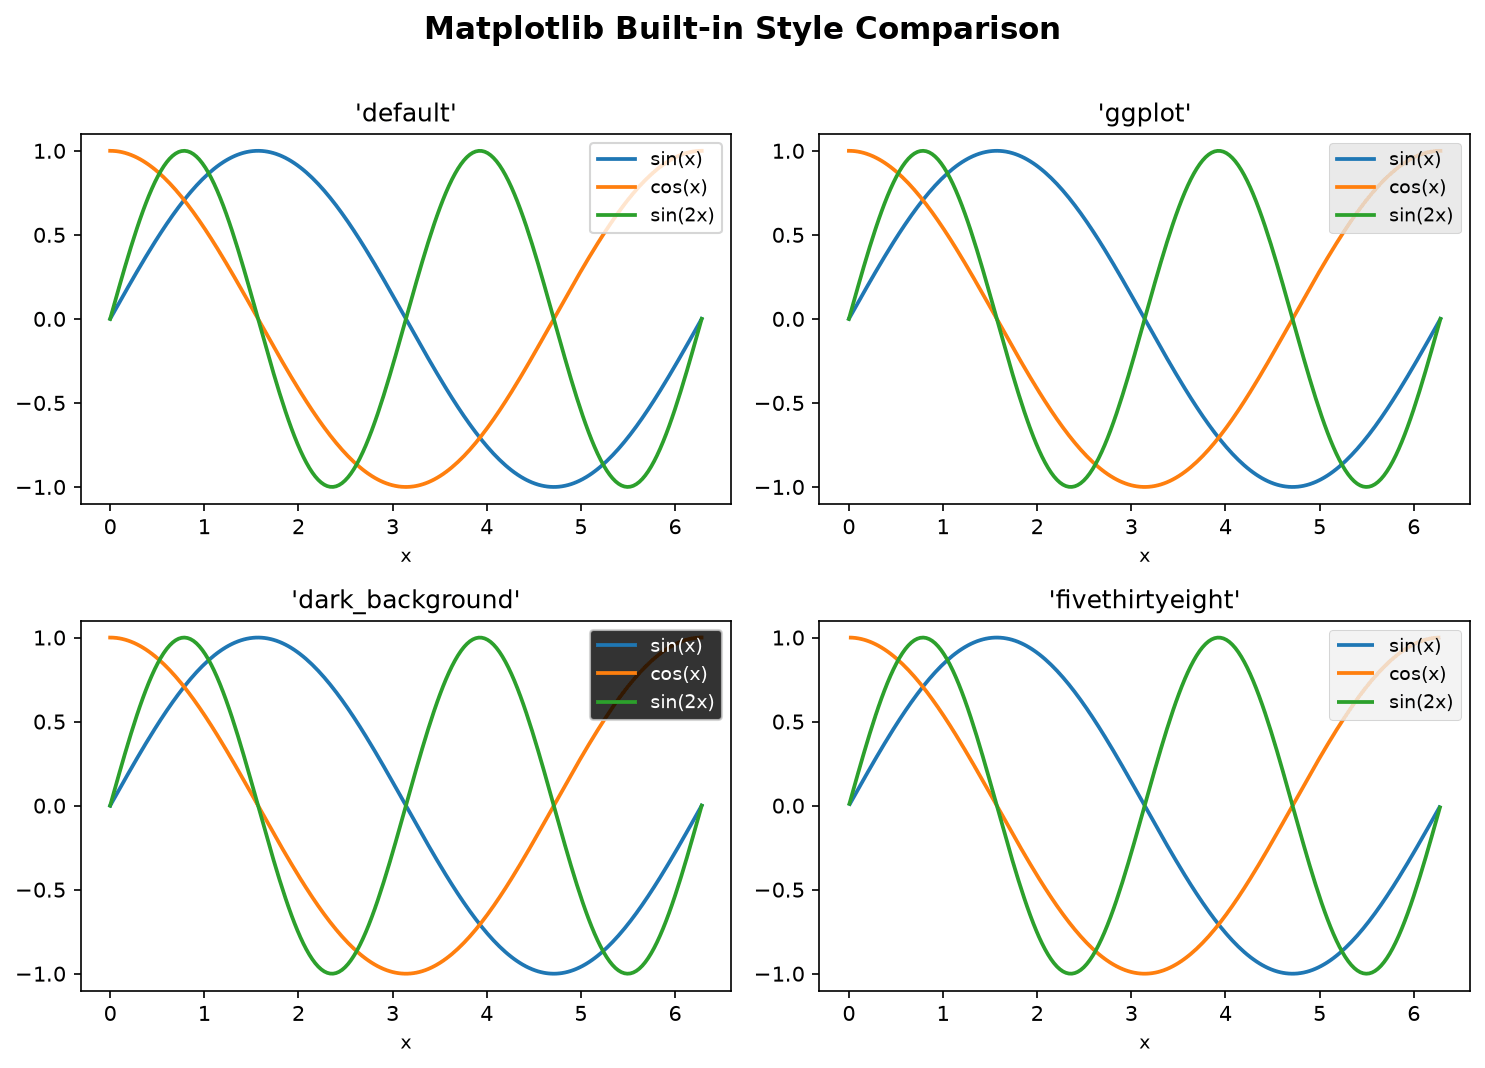
Style comparison
Overriding individual settings after a style
Styles set rcParams defaults, but you can always override them per-chart afterwards. The style doesn't lock anything:
plt.style.use('ggplot')

fig, ax = plt.subplots()
ax.plot(x, y, color='#264653', lw=3)   # overrides the style's default color
ax.set_facecolor('white')               # overrides the style's axes background