
TL;DR
Move the left and bottom spines to the zero coordinates, then hide the opposite spines:
fig, ax = plt.subplots()
ax.plot(x, y)

ax.spines["left"].set_position("zero")
ax.spines["bottom"].set_position("zero")
ax.spines["right"].set_visible(False)
ax.spines["top"].set_visible(False)

plt.show()
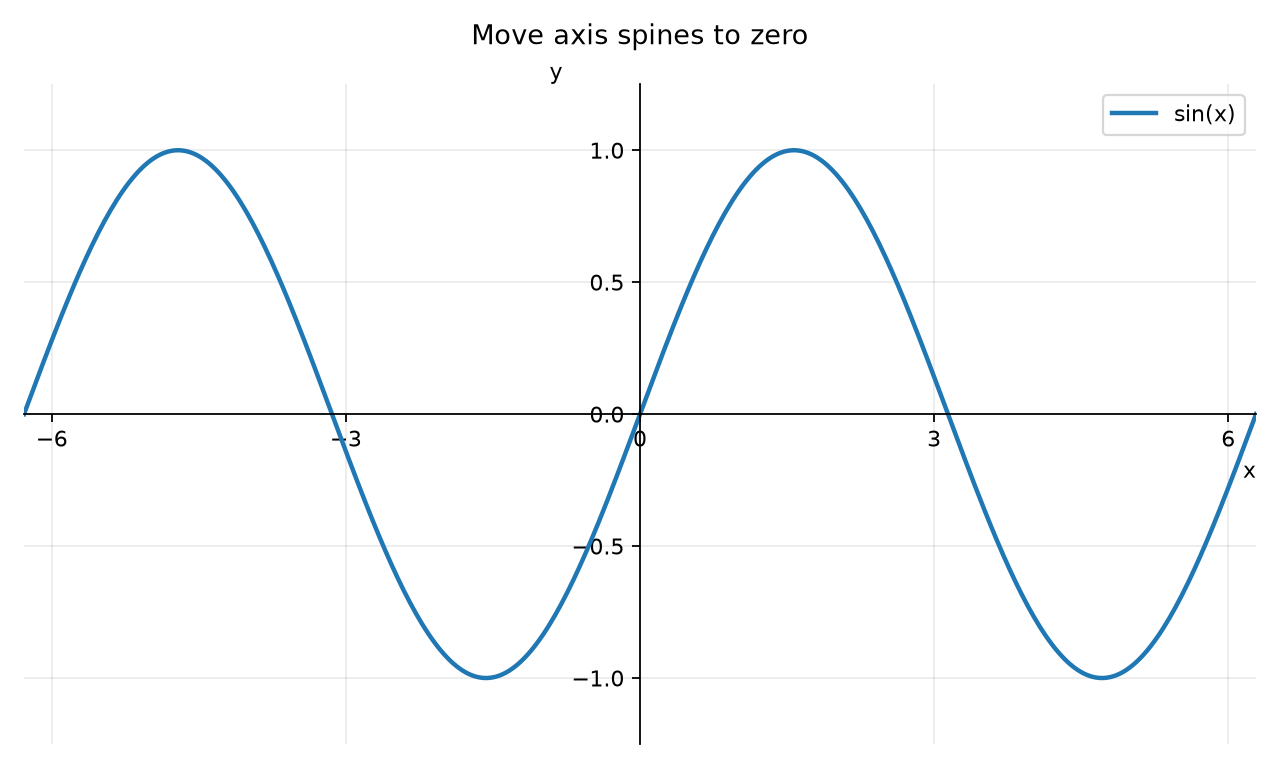
This is useful for functions, coordinate plots, and charts where zero should be the visual origin.
Move Only One Spine
Center just the x-axis or y-axis by moving one spine:
ax.spines["bottom"].set_position("zero")  # x-axis at y=0
ax.spines["left"].set_position("zero")    # y-axis at x=0
Move a Spine to Another Data Value
Use ("data", value) to position a spine at a different coordinate:
ax.spines["bottom"].set_position(("data", 5))
ax.spines["left"].set_position(("data", 10))
The first line moves the x-axis to y=5; the second moves the y-axis to x=10.
Keep Tick Labels on the Moved Spines
Matplotlib usually keeps the ticks with their spine. If you need to explicitly place them, use:
ax.xaxis.set_ticks_position("bottom")
ax.yaxis.set_ticks_position("left")