
TL;DR
Use matplotlib.dates.DateFormatter to customize the date format of tick labels (e.g., "Jan 2026" using "%b %Y"). Apply it using ax.xaxis.set_major_formatter(), and use fig.autofmt_xdate() to automatically rotate and align the labels.
import matplotlib.pyplot as plt
import matplotlib.dates as mdates

fig, ax = plt.subplots(figsize=(7, 4.5))
ax.plot(dates, values)

# 1. Format dates (e.g. "Jan 2026")
ax.xaxis.set_major_formatter(mdates.DateFormatter('%b %Y'))

# 2. Place ticks at start of each month
ax.xaxis.set_major_locator(mdates.MonthLocator())

# 3. Rotate and align date labels automatically
fig.autofmt_xdate()

plt.show()
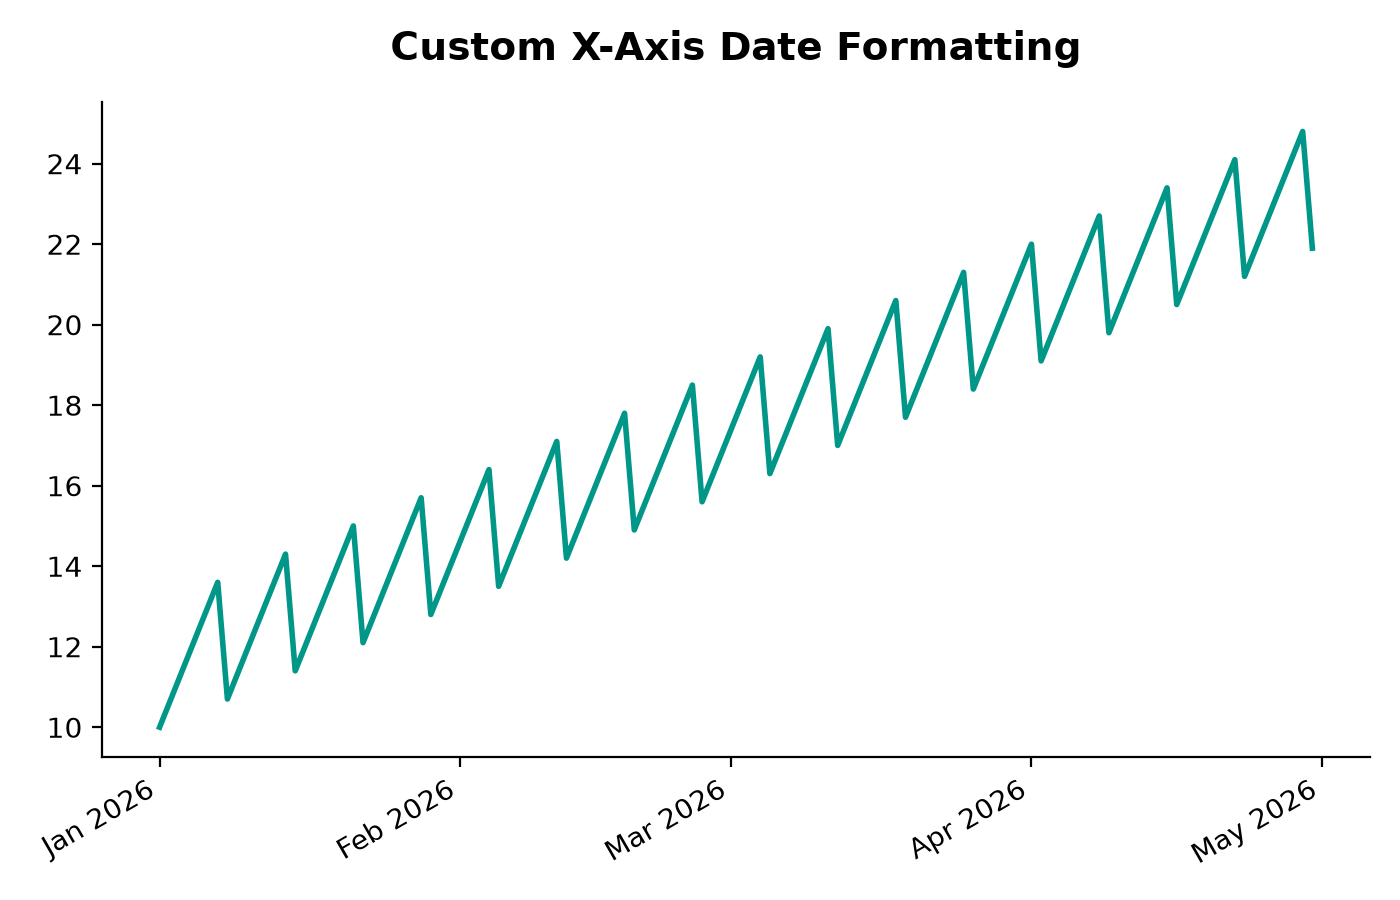
The matplotlib.dates Module
Matplotlib represents dates internally as floating-point numbers indicating the number of days since the epoch. To display these numbers as readable dates, import the matplotlib.dates module (conventionally imported as mdates).
Custom Date Formats (strftime)
To set a custom date format, pass a standard strftime directive string to mdates.DateFormatter.
Here are common format codes:
- %Y / %y: 4-digit / 2-digit year (e.g., 2026 / 26)
- %B / %b: Full month name / Abbreviated month name (e.g., January / Jan)
- %m: Month as a zero-padded number (e.g., 01)
- %d: Day of the month as a zero-padded number (e.g., 15)
- %d-%b-%Y: Outputs 15-Jan-2026
Once defined, pass the formatter to the axis:
# Format: Month Abbreviation Year (e.g., "Jan 2026")
formatter = mdates.DateFormatter('%b %Y')
ax.xaxis.set_major_formatter(formatter)
Controlling Tick Spacing with Locators
If Matplotlib places too many or too few ticks on your date axis, control the intervals using a tick locator:
# Show a tick every week
ax.xaxis.set_major_locator(mdates.WeekdayLocator(byweekday=mdates.MO, interval=1))

# Show a tick every month
ax.xaxis.set_major_locator(mdates.MonthLocator(interval=1))

# Show a tick every 3 months (quarterly)
ax.xaxis.set_major_locator(mdates.MonthLocator(interval=3))
Preventing Overlapping: autofmt_xdate()
Date labels are often long and overlap with each other. Instead of manually rotating them using tick parameters, call fig.autofmt_xdate().
This method automatically: 1. Rotates the active x-axis labels (by default 30 degrees). 2. Right-aligns the labels to make them clean and legible. 3. Adapts the formatting when you have multiple subplots sharing the date axis.
# Run this before plt.show()
fig.autofmt_xdate()