
TL;DR
Use invert_xaxis() or invert_yaxis() after plotting:
fig, ax = plt.subplots()
ax.plot(x, y)

ax.invert_xaxis()  # Largest x value appears on the left
# ax.invert_yaxis()  # Largest y value appears at the bottom

plt.show()
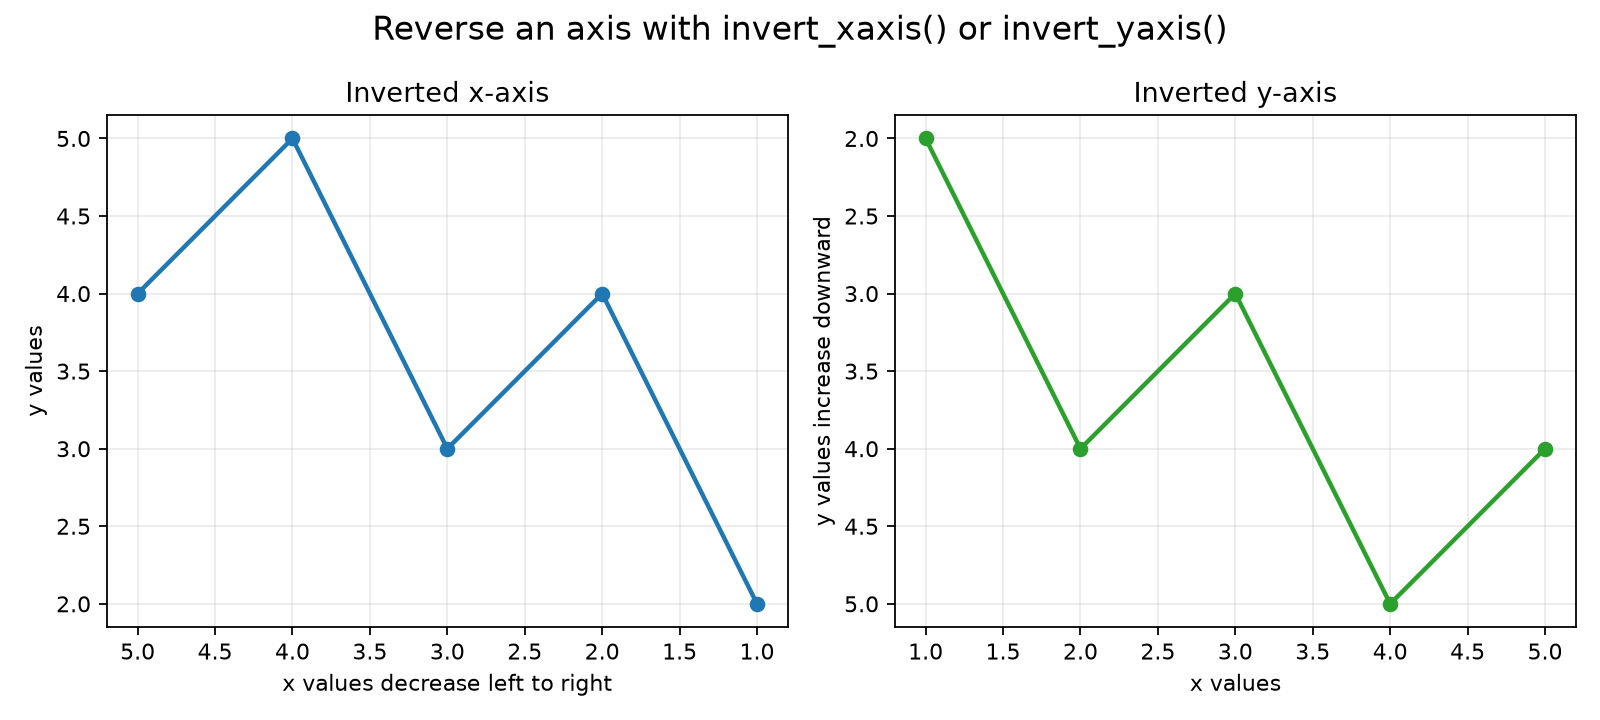
These methods preserve the current axis limits and simply reverse their displayed direction.
Reverse the X-Axis
An inverted x-axis is useful for countdowns, rankings, or any chart where values should decrease from left to right:
ax.invert_xaxis()
Reverse the Y-Axis
An inverted y-axis is common for image coordinates, where the origin is at the top-left:
ax.invert_yaxis()
Reverse Limits Directly
You can also set the limits in descending order:
ax.set_xlim(10, 0)
ax.set_ylim(100, 0)
This is handy when you want to set a specific range and reverse it in one call. If you only want to flip the existing direction, invert_xaxis() and invert_yaxis() are clearer.