
TL;DR
Use the title, title_fontsize, and fontsize parameters directly inside ax.legend() (or plt.legend()) to style your legend text.
import matplotlib.pyplot as plt

fig, ax = plt.subplots(figsize=(6, 4.5))
ax.scatter(ctrl_h, ctrl_w, label='Control Group', color='#7b1fa2')
ax.scatter(treat_h, treat_w, label='Treatment Group', color='#0097a7')

# Add a title, customize title font size, and change label font size
ax.legend(title='Study Cohorts', title_fontsize=12, fontsize=10, loc='upper left')

plt.show()
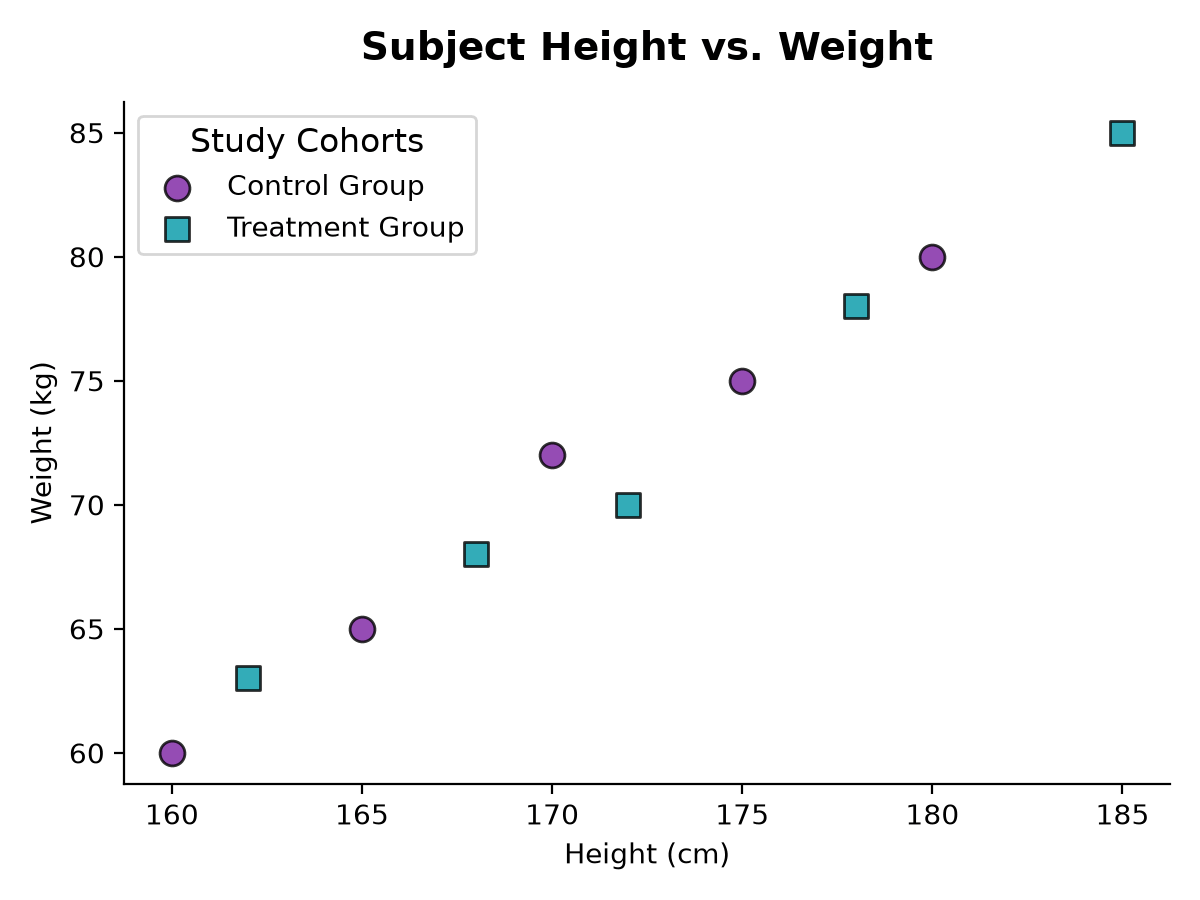
Customizing Title and Label Sizes
Matplotlib's legend() function supports parameters specifically for text sizing and titles:
title: Adds a text header at the top of the legend box.title_fontsize: Controls the font size of the header. Acceptable inputs include numeric values (e.g.,12) or scale strings (e.g.,'large','medium').fontsize: Controls the size of the legend label text (e.g.,10or'small').
Advanced Styling with the prop Parameter
If you want to configure other font properties—like font weight or family—for the legend label entries, use the prop dictionary parameter.
The prop parameter accepts a dictionary of font properties:
# Style labels with a specific family and weight
ax.legend(
    title='Study Cohorts',
    title_fontsize=12,
    prop={'family': 'serif', 'weight': 'bold', 'size': 10}
)
[!NOTE] The
propparameter only affects the legend items (labels), not the legend title. Usetitle_fontsizeor customize the title object directly to change the title font weight.
Customizing the Title Font Weight
To make the legend title bold or apply unique font settings, grab the title object from the returned legend instance and use .set_fontproperties() or .set_weight():
# Create the legend
leg = ax.legend(title='Study Cohorts', fontsize=10)

# Access and customize the title text object
leg.get_title().set_weight('bold')
leg.get_title().set_fontsize(12)
leg.get_title().set_color('#333333')