
TL;DR
Use set_xscale("log") or set_yscale("log") after creating your plot:
fig, ax = plt.subplots()
ax.plot(x, y)
ax.set_yscale("log")  # Logarithmic y-axis
# ax.set_xscale("log")  # Logarithmic x-axis
plt.show()
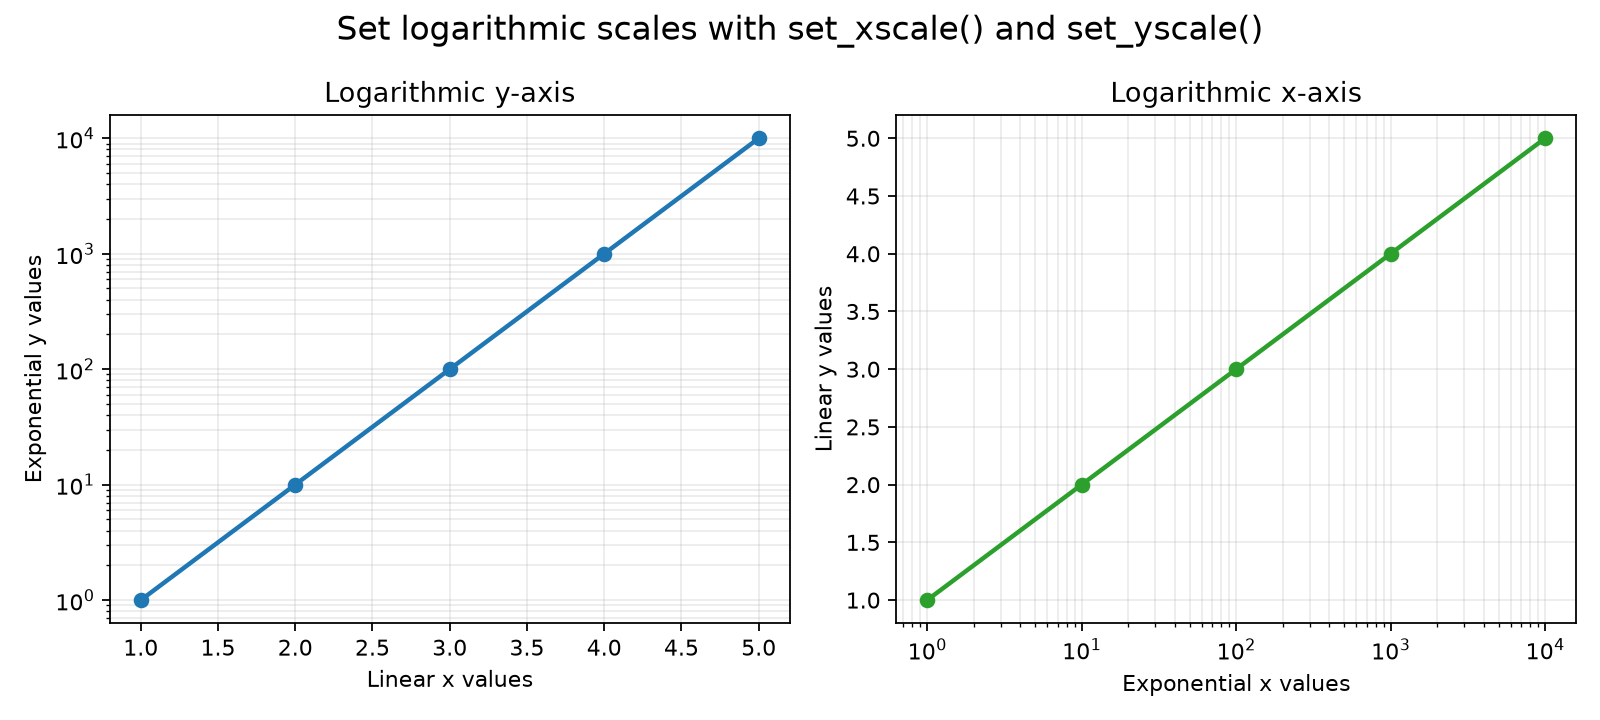
Log scales are useful when values span several orders of magnitude. Each major step represents multiplication by the base, usually 10, rather than adding a fixed amount.
Logarithmic Y-Axis
For data that grows or shrinks exponentially, set the y-axis to log scale:
import matplotlib.pyplot as plt

x = [1, 2, 3, 4, 5]
y = [1, 10, 100, 1_000, 10_000]

fig, ax = plt.subplots()
ax.plot(x, y, marker="o")
ax.set_yscale("log")
plt.show()
Logarithmic X-Axis
Set the x-axis instead when the x values cover a wide range:
x = [1, 10, 100, 1_000, 10_000]
y = [1, 2, 3, 4, 5]

fig, ax = plt.subplots()
ax.plot(x, y, marker="o")
ax.set_xscale("log")
plt.show()
Use a Different Base
Base 10 is the default. Pass base to use another base, such as 2:
ax.set_yscale("log", base=2)
Logarithmic axes require positive values. Zero and negative values cannot be displayed on a standard log scale.