
TL;DR
Use fig.add_hline(...) and fig.add_vline(...) for clean reference lines in Plotly, or use layout.shapes for fully custom line styling.
import plotly.graph_objects as go

fig = go.Figure(data=[
    go.Scatter(x=[1, 2, 3], y=[4, 5, 2], mode='lines+markers')
])
fig.add_hline(y=4, line_dash='dash', line_color='red')
fig.add_vline(x=2, line_dash='dash', line_color='blue')
fig.show()
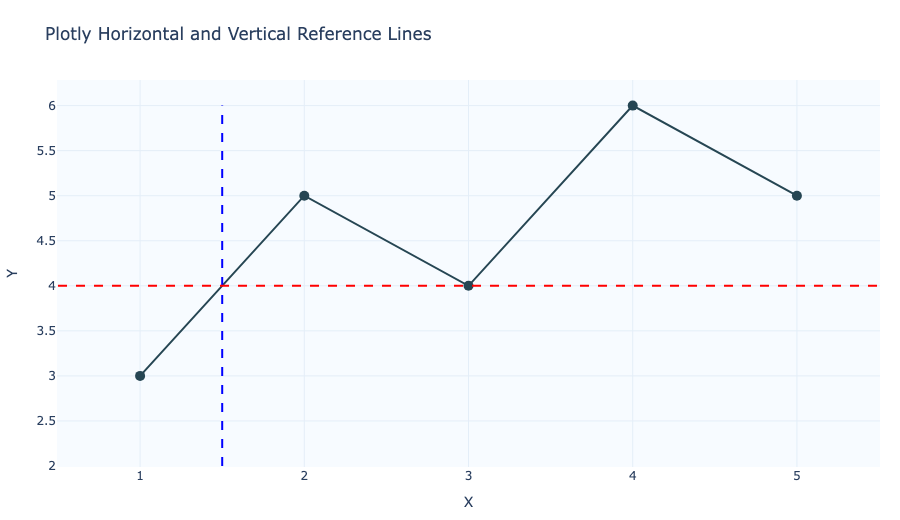
Add a horizontal line with add_hline()
Plotly's fig.add_hline() adds a reference line at a constant y value. It is ideal for thresholds, targets, and annotation lines.
import plotly.graph_objects as go

fig = go.Figure(data=[go.Scatter(x=[1, 2, 3], y=[4, 5, 2], mode='lines+markers')])
fig.add_hline(y=4, line_dash='dash', line_color='red')
fig.show()
Add a vertical line with add_vline()
Use fig.add_vline() to draw a reference at a constant x value.
import plotly.graph_objects as go

fig = go.Figure(data=[go.Scatter(x=[1, 2, 3], y=[4, 5, 2], mode='lines+markers')])
fig.add_vline(x=2, line_dash='dash', line_color='blue')
fig.show()
Use layout.shapes for custom lines
For finer control over position and style, define line shapes in layout.shapes.
import plotly.graph_objects as go

fig = go.Figure(data=[go.Scatter(x=[1, 2, 3], y=[4, 5, 2], mode='lines+markers')])
fig.update_layout(
    shapes=[
        dict(
            type='line',
            x0=1.5,
            x1=1.5,
            y0=2,
            y1=6,
            line=dict(color='blue', dash='dash')
        ),
        dict(
            type='line',
            x0=0.5,
            x1=3.5,
            y0=4,
            y1=4,
            line=dict(color='red', dash='dash')
        )
    ]
)
fig.show()
Add labels or annotations to the line
Combine horizontal/vertical lines with add_annotation() to explain the reference value.
import plotly.graph_objects as go

fig = go.Figure(data=[go.Scatter(x=[1, 2, 3], y=[4, 5, 2], mode='lines+markers')])
fig.add_hline(y=4, line_dash='dash', line_color='red')
fig.add_vline(x=2, line_dash='dash', line_color='blue')
fig.add_annotation(
    x=2,
    y=4.1,
    text='Target',
    showarrow=False,
    font=dict(color='red')
)
fig.show()
Summary
- Use
add_hline()for horizontal reference lines. - Use
add_vline()for vertical reference lines. - Use
layout.shapeswhen you need fully custom line placement or style. - Add annotations to make threshold and event lines easier to interpret.