
Plotly
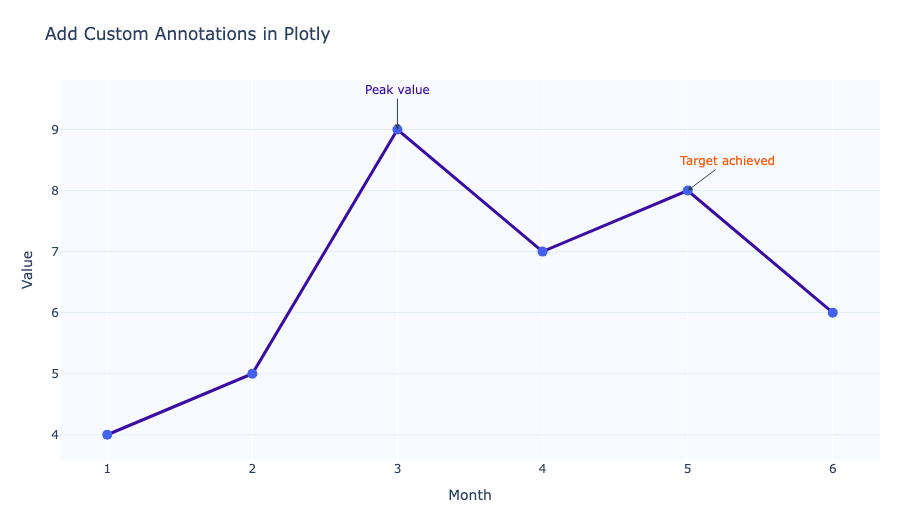
How to Add Custom Annotations in Plotly
Add custom annotations to Plotly charts to label points, highlight ranges, and explain insights.
Add custom annotations to Plotly charts to label points, highlight ranges, and explain insights.
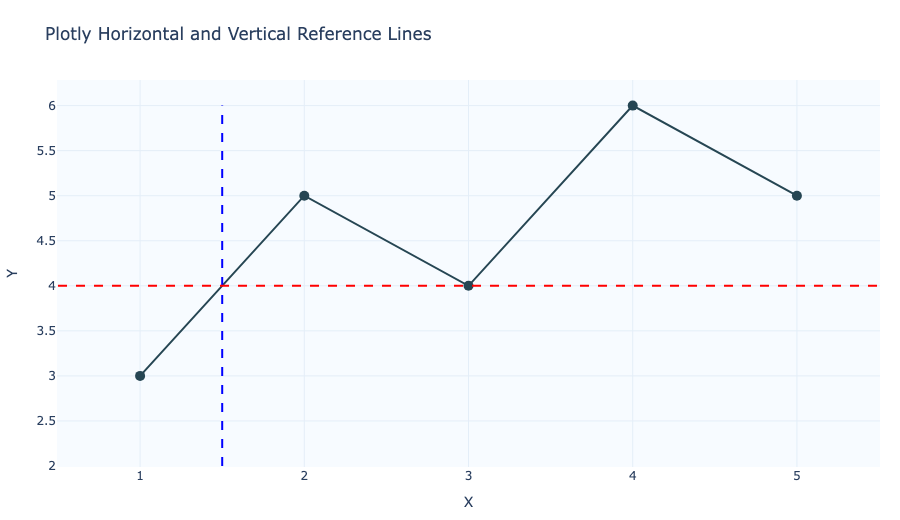
Add horizontal and vertical reference lines to Plotly charts with add_hline, add_vline, or layout.shapes.
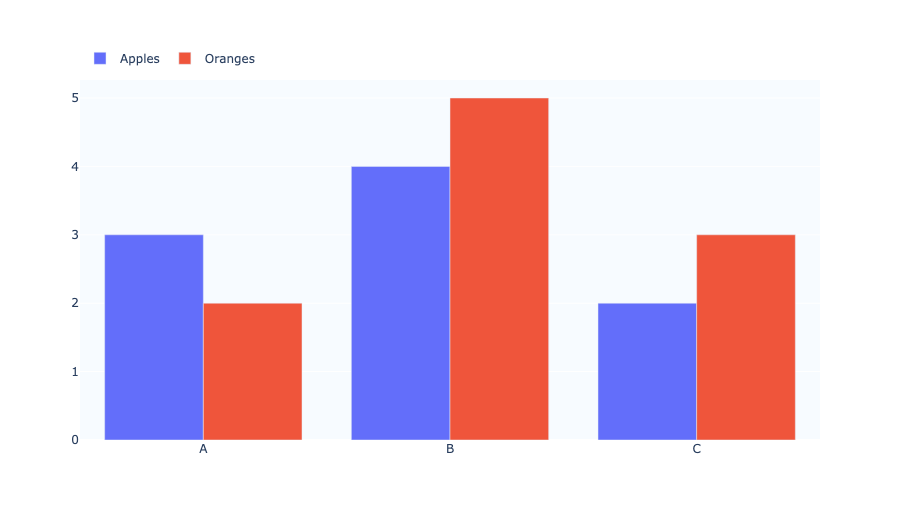
Learn how to position Plotly legends using layout.legend and flexible placement options.
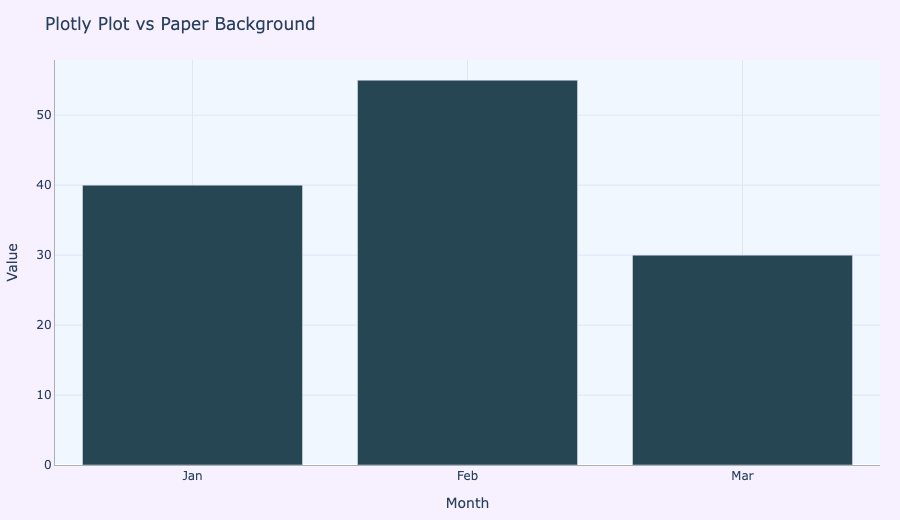
Change Plotly background colors with plot_bgcolor and paper_bgcolor.
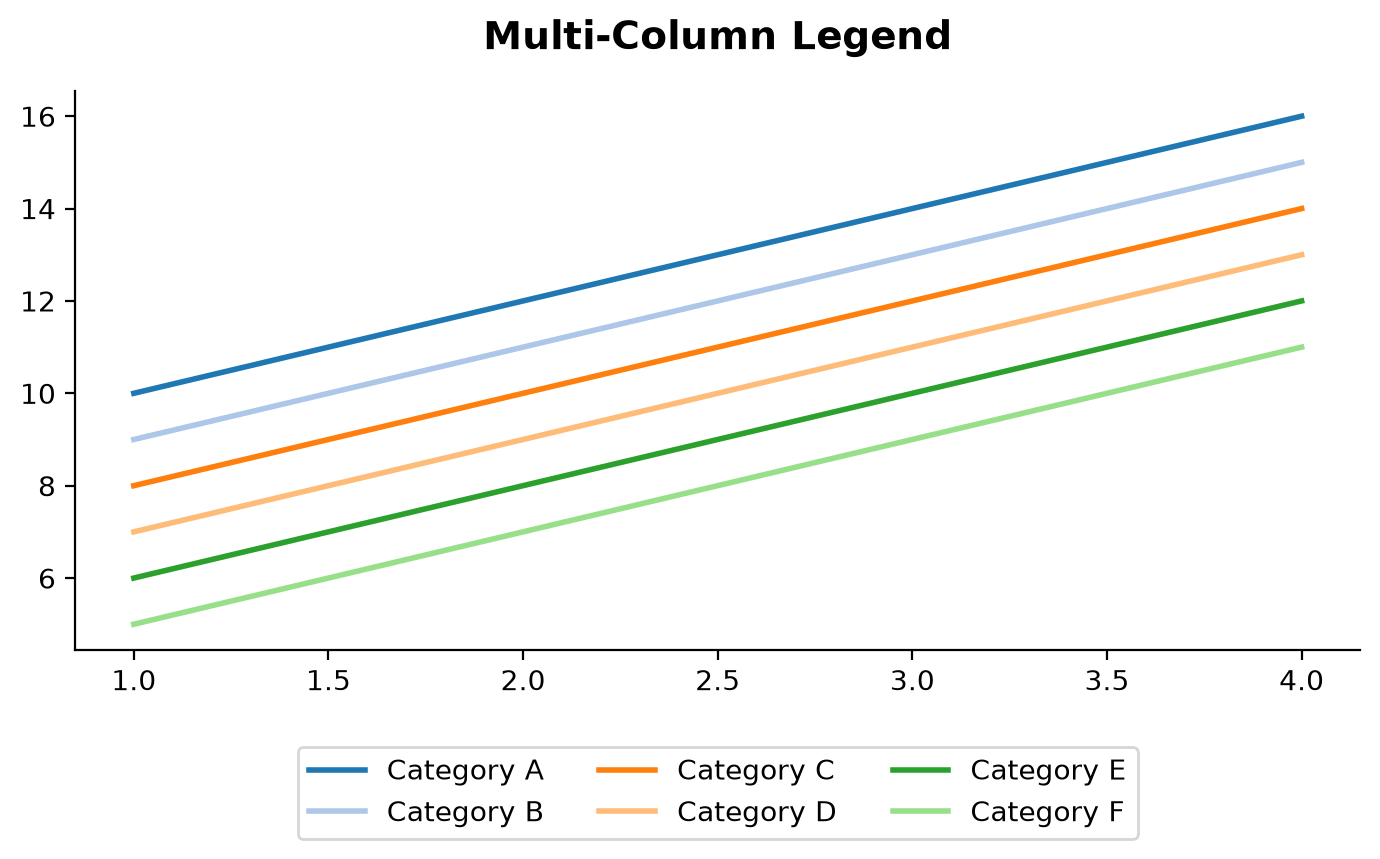
Quick guide on formatting a Matplotlib legend into multiple columns using the ncol parameter.
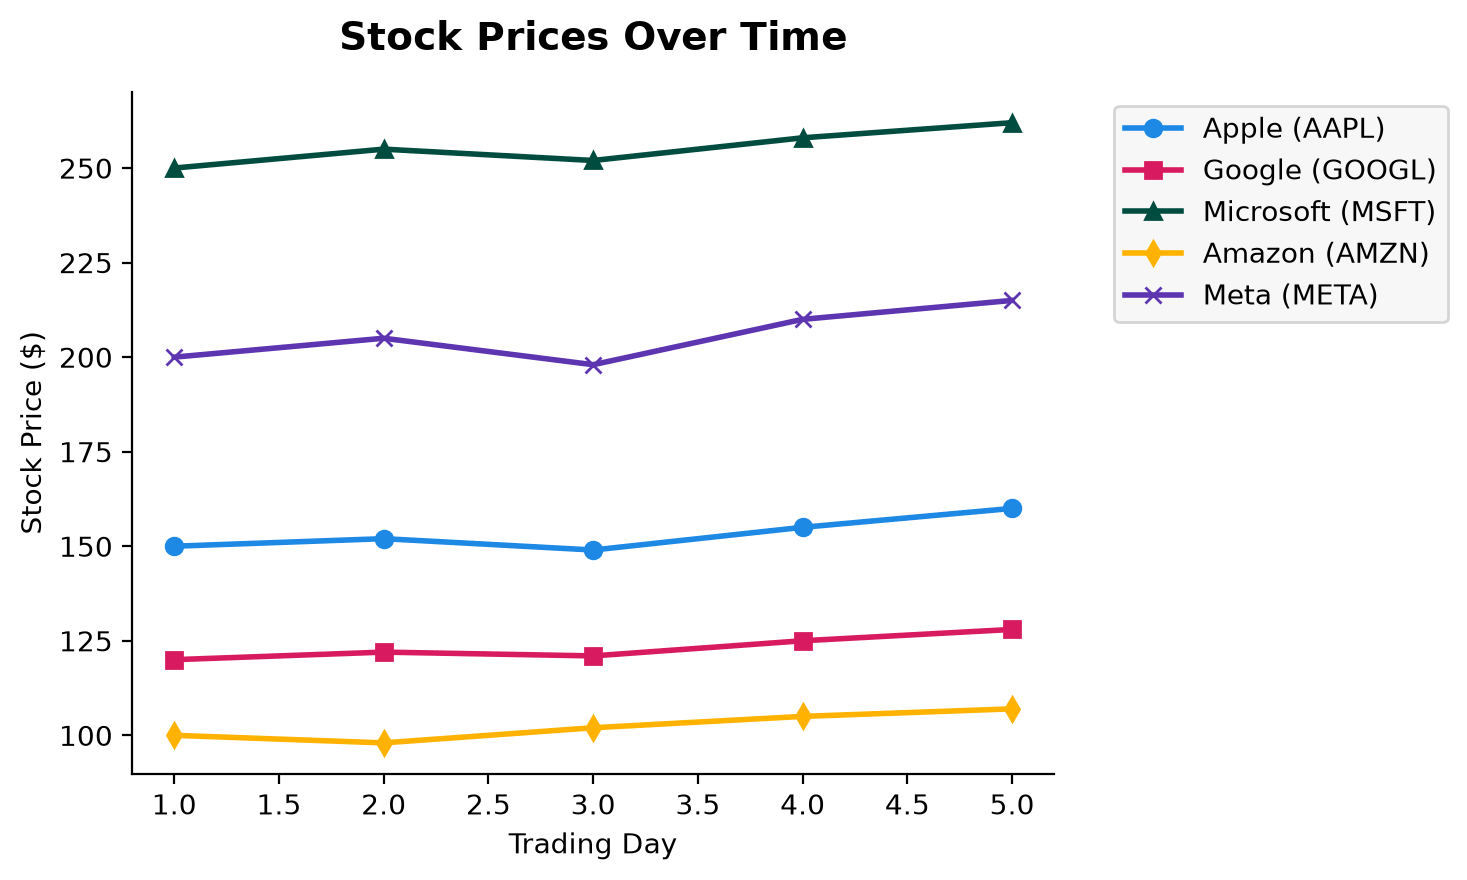
Learn how to position your Matplotlib legend outside of the chart area using bbox_to_anchor.
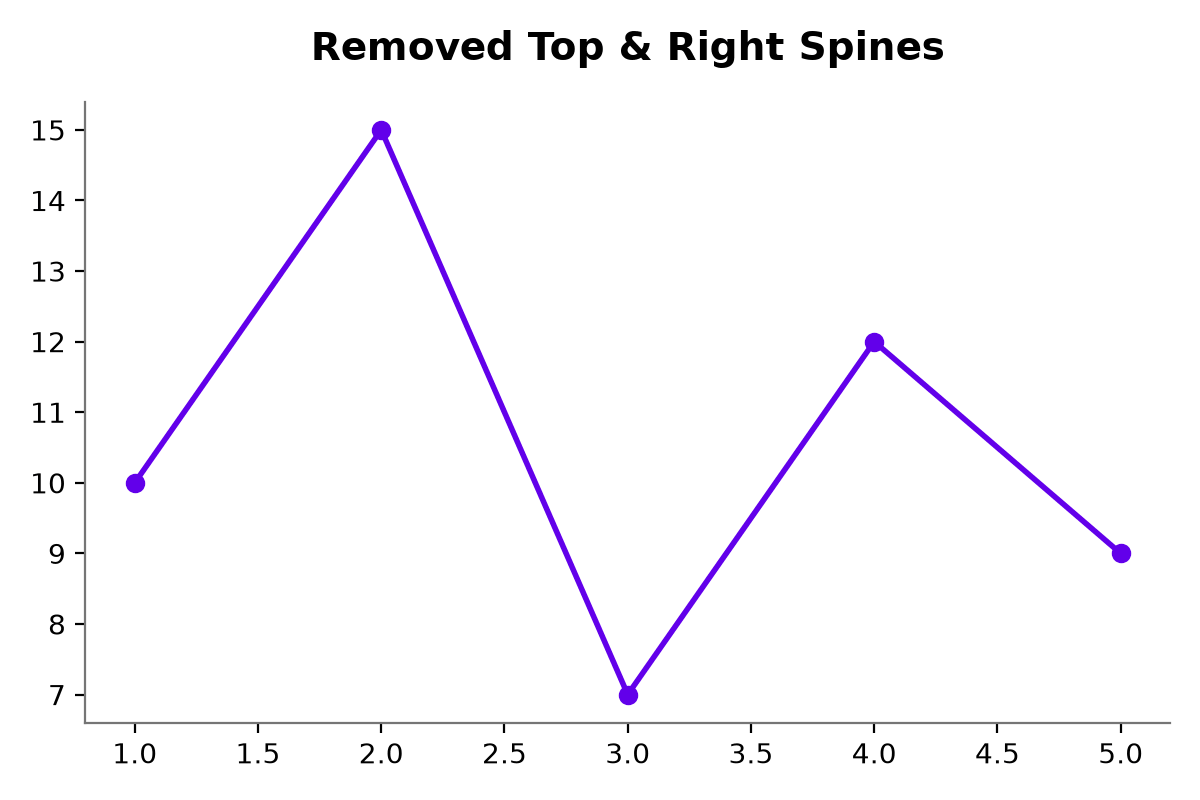
Clear tutorial on removing the outer border (spines) from a Matplotlib chart for a clean, modern aesthetic.