
TL;DR
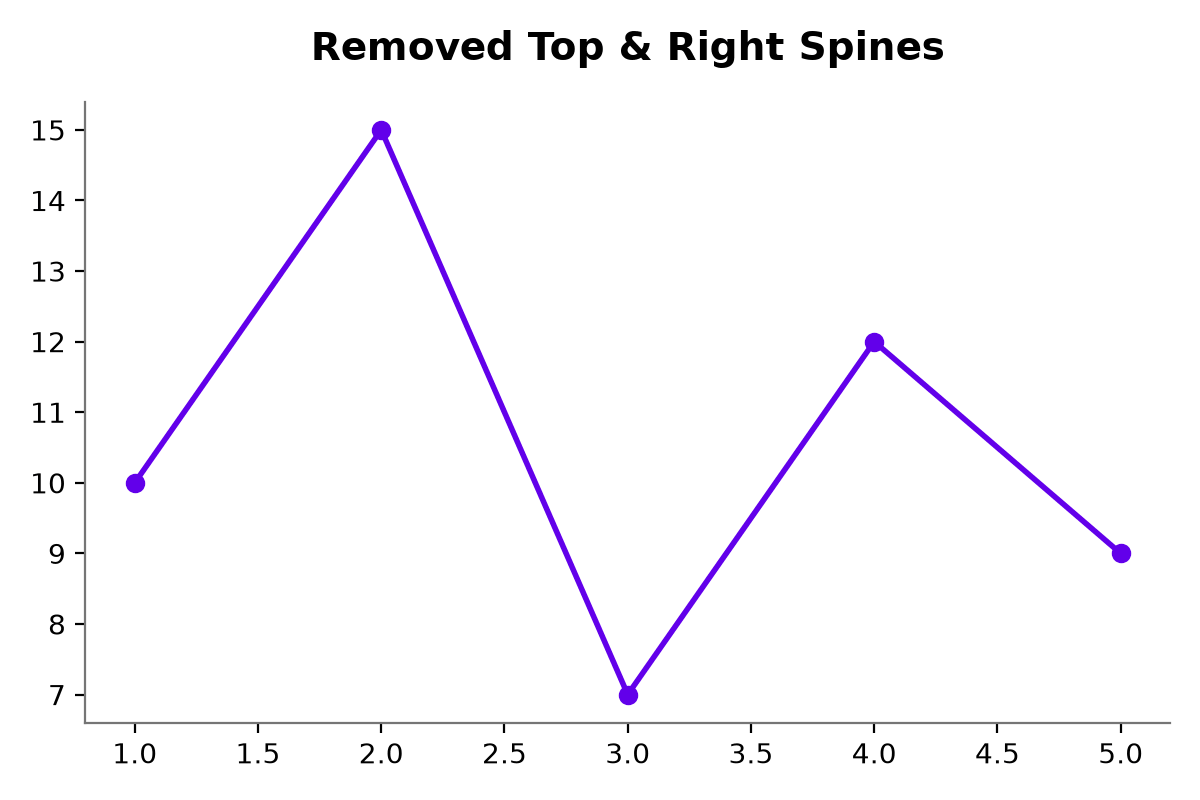
To remove specific borders (spines), select the spine from ax.spines and call set_visible(False). A clean layout often hides the top and right spines.
import matplotlib.pyplot as plt

fig, ax = plt.subplots(figsize=(6, 4))
ax.plot([1, 2, 3], [10, 15, 12])

# Remove top and right spines
ax.spines['top'].set_visible(False)
ax.spines['right'].set_visible(False)

plt.show()
What are Spines?
In Matplotlib, the lines connecting the axis tick marks and framing the plot area are called spines. By default, Matplotlib draws four spines: 'top', 'bottom', 'left', and 'right'.
Removing the top and right spines is a common design pattern that reduces visual noise and draws more focus to your data.
Hiding Specific Spines
To hide particular spines, access them by name from the ax.spines dictionary and call .set_visible(False):
# Hide the top and right spines
ax.spines['top'].set_visible(False)
ax.spines['right'].set_visible(False)
Hiding All Spines (Border-Free Plots)
If you are creating a heatmap, pie chart, or a diagram that requires a completely clean canvas, loop through all four spines to hide them entirely:
fig, ax = plt.subplots()
ax.plot(x, y)

# Hide all borders
for spine in ax.spines.values():
    spine.set_visible(False)
Alternatively, you can loop through the list of spine names:
for spine in ['top', 'bottom', 'left', 'right']:
    ax.spines[spine].set_visible(False)
Hiding Spines Globally using rcParams
To remove spines from all plots across a notebook or project without repeating code, configure Matplotlib's global settings:
import matplotlib.pyplot as plt

# Disable top and right spines globally
plt.rcParams['axes.spines.top'] = False
plt.rcParams['axes.spines.right'] = False

# Create any plot - top and right spines will be hidden by default
fig, ax = plt.subplots()
ax.plot([1, 2, 3], [10, 15, 12])
Alternative: Using Seaborn despine()
If you have Seaborn installed, you can use its sns.despine() helper function to quickly strip the top and right spines from the active plot:
import matplotlib.pyplot as plt
import seaborn as sns

plt.plot([1, 2, 3], [10, 15, 12])

# Removes top and right spines by default
sns.despine()
To remove the left or bottom spines as well with Seaborn, pass them as arguments:
# Remove all spines using Seaborn
sns.despine(left=True, bottom=True)