
TL;DR
Use the ncol parameter inside ax.legend() (or plt.legend()) to specify how many columns the legend should display.
import matplotlib.pyplot as plt

fig, ax = plt.subplots(figsize=(7, 4.5))

# Plotting 6 series
for i in range(6):
    ax.plot([1, 2, 3], [x * (i + 1) for x in [1, 2, 3]], label=f'Category {chr(65 + i)}')

# Render a 3-column legend below the plot box
ax.legend(ncol=3, loc='upper center', bbox_to_anchor=(0.5, -0.15))

plt.savefig('plot.png', bbox_inches='tight')
plt.show()
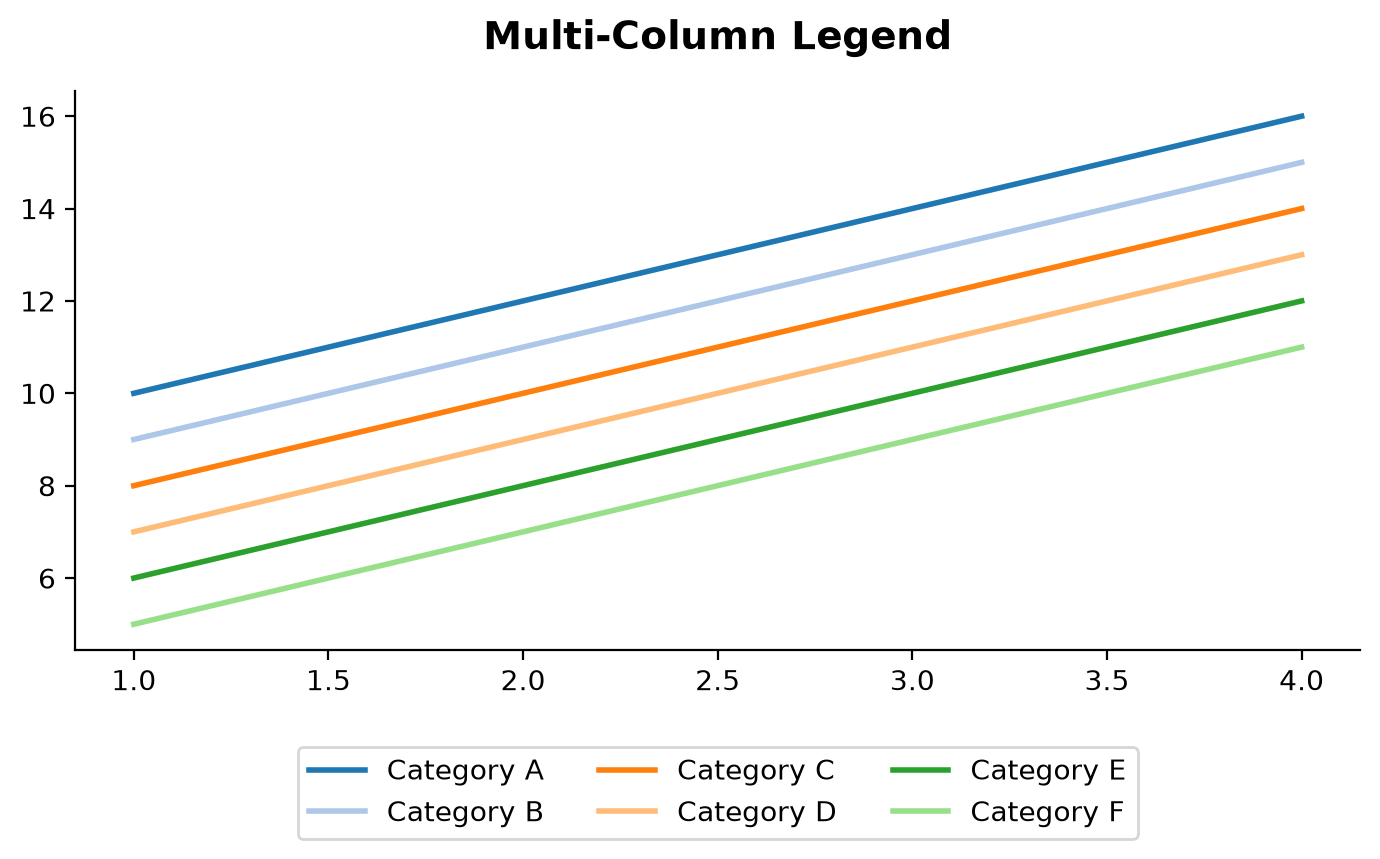
When to Use Multiple Columns
By default, Matplotlib stacks all legend items vertically in a single column. If your chart contains more than 4 or 5 datasets, a single vertical column takes up too much height.
Splitting the legend entries into two or more columns arranges them horizontally, which fits well: - Below the horizontal x-axis. - Stretched across the top margin above the title. - Placed horizontally inside a wide subplot.
Splitting into Columns (ncol)
The ncol parameter takes an integer representing the maximum number of columns. Matplotlib will automatically partition your legend items into those columns:
# Two columns
ax.legend(ncol=2)

# Three columns
ax.legend(ncol=3)
If you have 6 items and set ncol=3, you will get a grid with 2 rows and 3 columns. If the total number of items is not perfectly divisible by ncol, Matplotlib will fill the columns from left to right, leaving the last column with fewer items.
Adjusting Column Spacing
If your labels are wide or too close together, you can tweak the column spacing using these layout parameters:
columnspacing: The spacing between columns. Defaults to2.0(measured in font size units).handletextpad: The pad between the legend line/marker and the text label. Defaults to0.8.labelspacing: The vertical space between rows of legend entries. Defaults to0.5.
For example, to tighten a 3-column legend:
ax.legend(ncol=3, columnspacing=1.5, handletextpad=0.5)