
TL;DR
Use bbox_to_anchor in ax.legend() to specify the legend's bounding box coordinates relative to the plot. Use bbox_inches='tight' in plt.savefig() to prevent the legend from being clipped.
import matplotlib.pyplot as plt

days = [1, 2, 3, 4, 5]
apple = [150, 152, 149, 155, 160]
google = [120, 122, 121, 125, 128]
microsoft = [250, 255, 252, 258, 262]

fig, ax = plt.subplots(figsize=(7.5, 4.5))
ax.plot(days, apple, label='Apple (AAPL)', marker='o')
ax.plot(days, google, label='Google (GOOGL)', marker='s')
ax.plot(days, microsoft, label='Microsoft (MSFT)', marker='^')

# Position the legend outside (1.05 horizontally, 1.0 vertically)
ax.legend(bbox_to_anchor=(1.05, 1), loc='upper left')

# Crucial: Prevent clipping when saving
plt.savefig('plot.png', bbox_inches='tight')
plt.show()
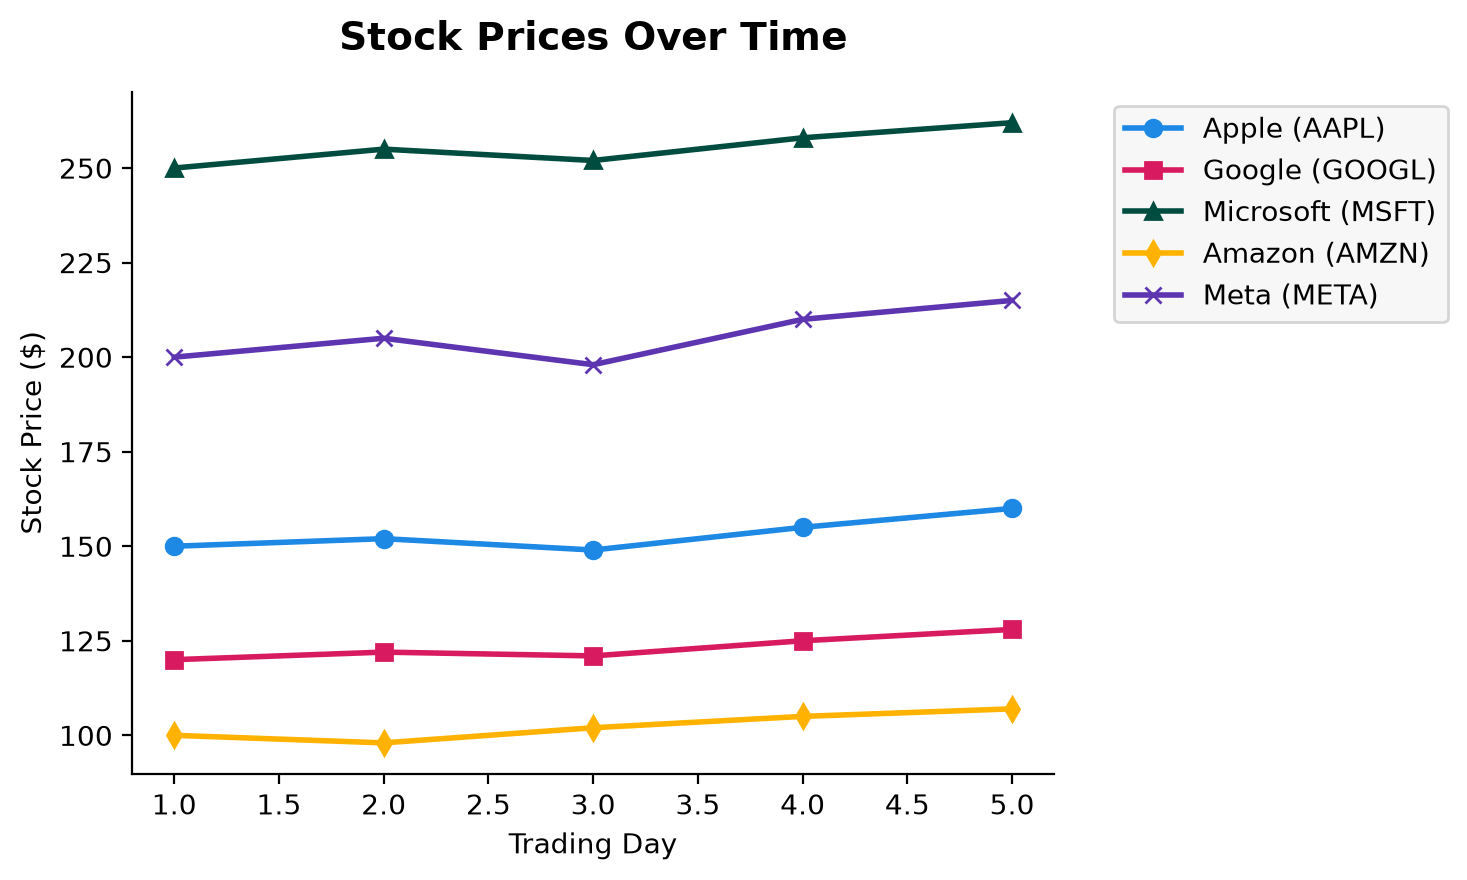
How bbox_to_anchor Works
By default, Matplotlib places the legend inside the plot boundary using the loc parameter (e.g., loc='upper right').
To move it outside, use bbox_to_anchor. This parameter defines a bounding box for the legend relative to your axes coordinates:
- The first number is the horizontal coordinate (x). 0 is the left edge, and 1 is the right edge of the plot.
- The second number is the vertical coordinate (y). 0 is the bottom edge, and 1 is the top edge of the plot.
Passing a value greater than 1 (like 1.05) moves the legend outside the right margin.
Common Positions
1. Outside on the Right (Upper Alignment)
This is the most common layout when you have a list of vertical categories:
# Anchored just outside the right edge (1.05), aligned with the top (1.0)
ax.legend(bbox_to_anchor=(1.05, 1), loc='upper left')
2. Outside on the Right (Centered Alignment)
To vertically center the legend along the right side:
# Anchored outside the right edge (1.05), aligned with the vertical center (0.5)
ax.legend(bbox_to_anchor=(1.05, 0.5), loc='center left')
3. Outside at the Bottom (Horizontal Legend)
If you have a wide chart, placing the legend below the plot is often cleaner. Set ncol to arrange items horizontally instead of vertically:
# Anchored below the bottom (vertical coordinate -0.15)
# Centered horizontally (horizontal coordinate 0.5)
ax.legend(bbox_to_anchor=(0.5, -0.15), loc='upper center', ncol=3)
Critical: Prevent Clipping when Saving
When you move a legend outside the axis box, Matplotlib may not account for it in the default figure margin calculations, causing the legend to get clipped in the saved output.
Always pass bbox_inches='tight' to plt.savefig() to automatically recalculate the figure bounds:
plt.savefig('output.png', bbox_inches='tight')