
TL;DR
Use fig.update_xaxes() and fig.update_yaxes() with scaleanchor, scaleratio, and constrain='domain' to set fixed aspect ratios for Plotly subplots.
from plotly.subplots import make_subplots
import plotly.graph_objects as go

fig = make_subplots(rows=1, cols=2)
fig.add_trace(go.Scatter(x=[1, 2, 3], y=[1, 4, 9]), row=1, col=1)
fig.add_trace(go.Scatter(x=[1, 2, 3], y=[3, 2, 1]), row=1, col=2)

fig.update_xaxes(scaleanchor='y', scaleratio=1, row=1, col=1)
fig.update_yaxes(scaleanchor='x', scaleratio=1, row=1, col=2)
fig.show()
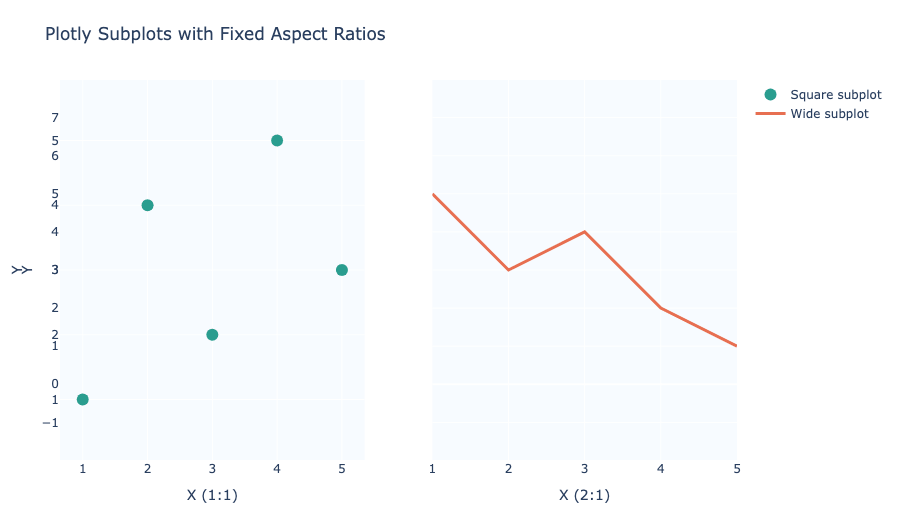
Why fixed aspect ratios matter
When you use subplots, each axis can scale independently by default. That means circles can become ovals and distances can look different between panes. Fixed aspect ratios keep units equal on both axes.
Create subplots with make_subplots()
Use plotly.subplots.make_subplots() to create a grid and then update each axis separately.
from plotly.subplots import make_subplots
import plotly.graph_objects as go

fig = make_subplots(rows=2, cols=2)
fig.add_trace(go.Scatter(x=[1, 2, 3], y=[1, 4, 9]), row=1, col=1)
fig.add_trace(go.Scatter(x=[1, 2, 3], y=[3, 2, 1]), row=1, col=2)
fig.add_trace(go.Scatter(x=[1, 2, 3], y=[2, 6, 5]), row=2, col=1)
fig.add_trace(go.Scatter(x=[1, 2, 3], y=[4, 1, 3]), row=2, col=2)
fig.show()
Fix one subplot to a 1:1 aspect ratio
Use scaleanchor and scaleratio on matching axes.
fig.update_xaxes(scaleanchor='y', scaleratio=1, row=1, col=1)
fig.update_yaxes(scaleanchor='x', scaleratio=1, row=1, col=1)
This forces the x-axis and y-axis to share the same scale.
Set a custom ratio such as 2:1
Use scaleratio=2 or scaleratio=0.5 to change the ratio.
fig.update_xaxes(scaleanchor='y', scaleratio=2, row=1, col=2)
fig.update_yaxes(scaleanchor='x', scaleratio=2, row=1, col=2)
That makes one horizontal unit twice as wide as one vertical unit.
Use constrain='domain' when sharing axes
If the subplot axis must maintain a fixed domain size, use:
fig.update_xaxes(constrain='domain', row=1, col=1)
fig.update_yaxes(constrain='domain', row=1, col=1)
This prevents auto-scaling from stretching the subplot.
Summary
- Use
make_subplots()to build subplot grids. - Use
scaleanchor+scaleratioto lock axis proportions. - Set
constrain='domain'when you want fixed drawing areas. - Use different scaling values for square and rectangular subplot layouts.