
Pandas
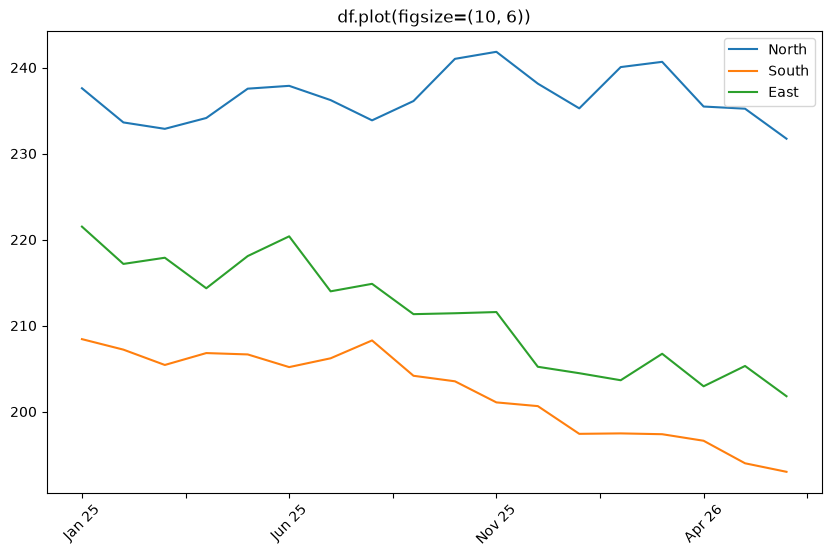
Change Figure Size when using df.plot() in Pandas
Change the figure size for Pandas df.plot() charts with figsize, plt.subplots, and rcParams.
Change the figure size for Pandas df.plot() charts with figsize, plt.subplots, and rcParams.
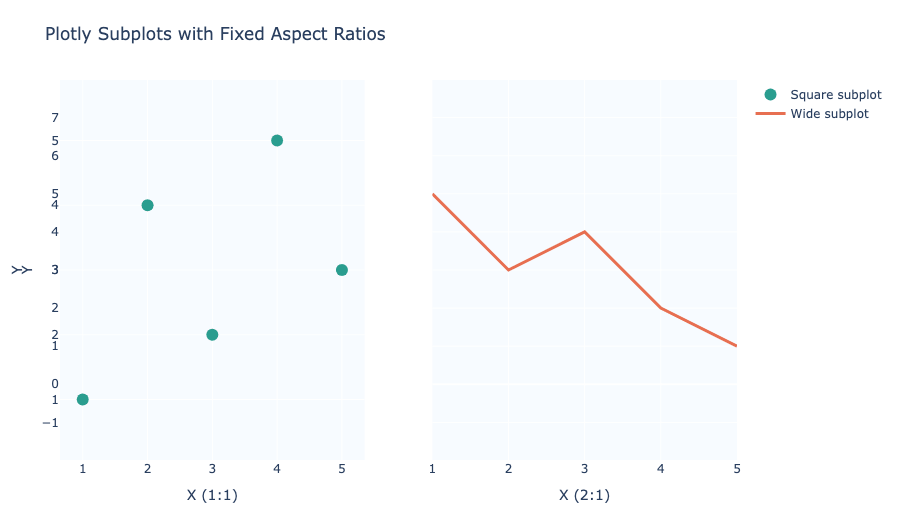
Keep Plotly subplot axes proportional by fixing aspect ratios with scaleanchor and scaleratio.
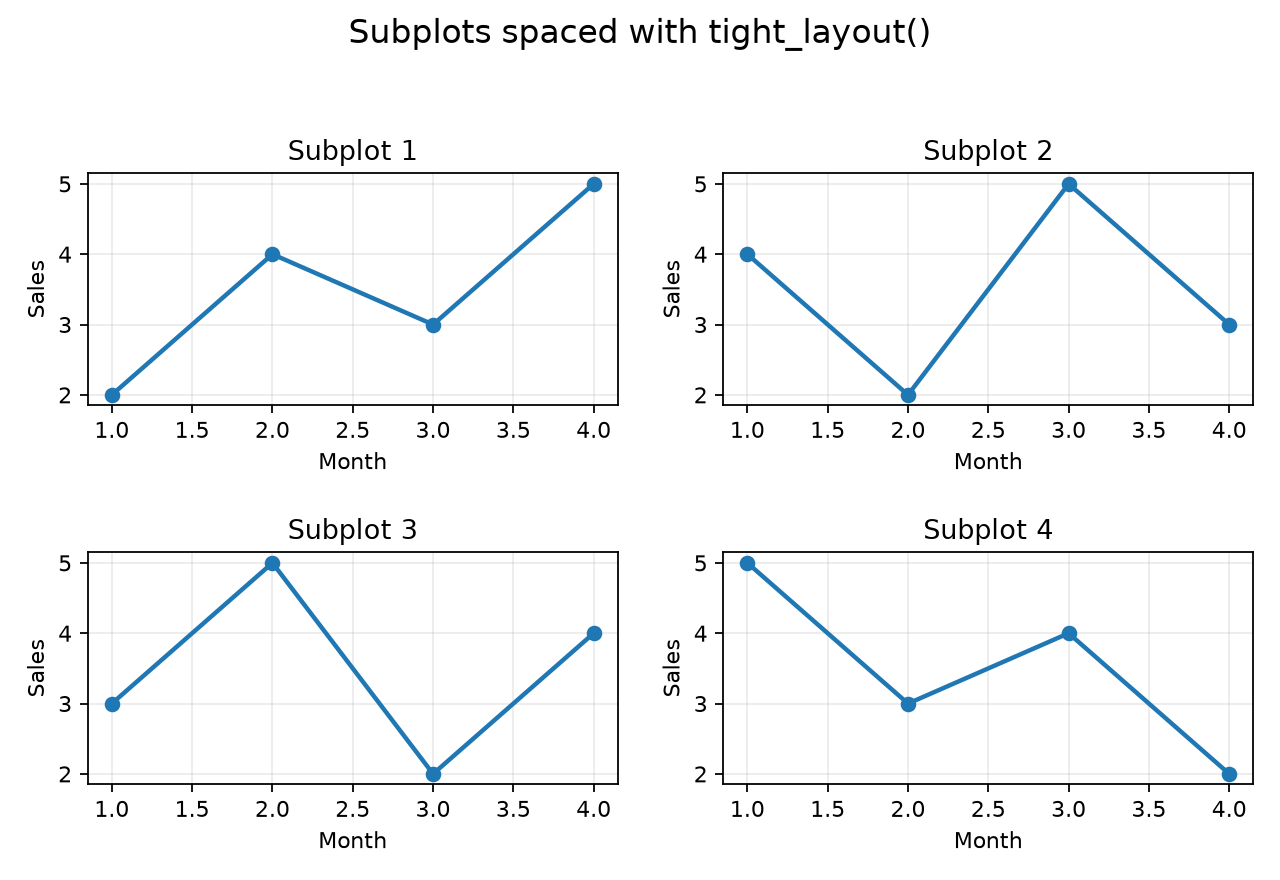
Automatically adjust Matplotlib subplot spacing and margins with tight_layout.

How to use subplots in Matplotlib to create multiple plots in a single figure