
Pandas
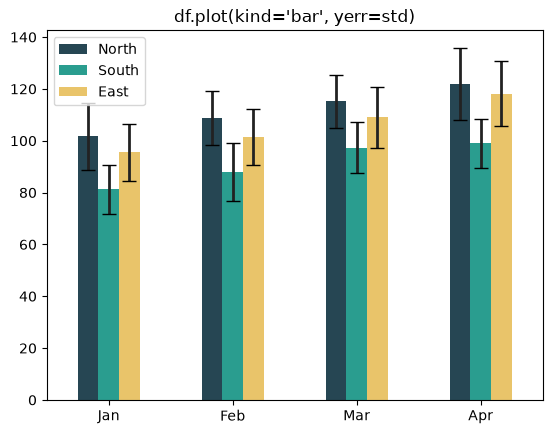
How to Add Error Bars to Pandas DataFrame Plots
Add error bars to Pandas DataFrame plots with yerr and xerr on df.plot.
Add error bars to Pandas DataFrame plots with yerr and xerr on df.plot.
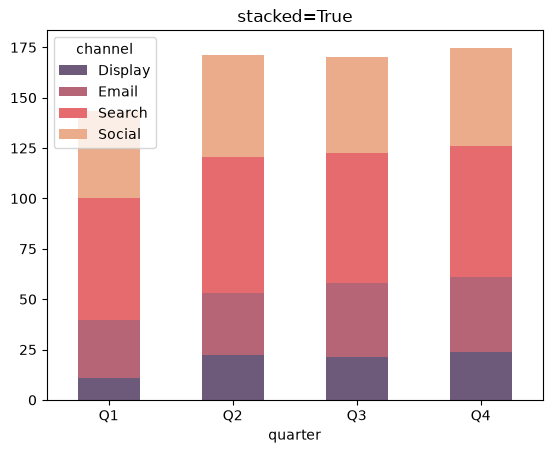
Plot stacked and unstacked bar charts in Pandas with df.plot and the stacked argument.
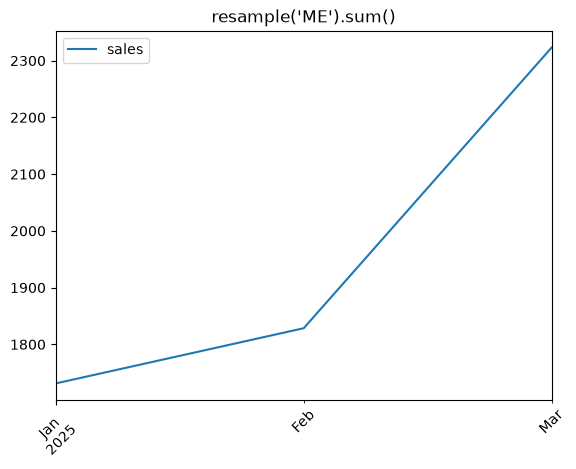
Resample time series data to a custom frequency in Pandas and plot the result with df.plot.
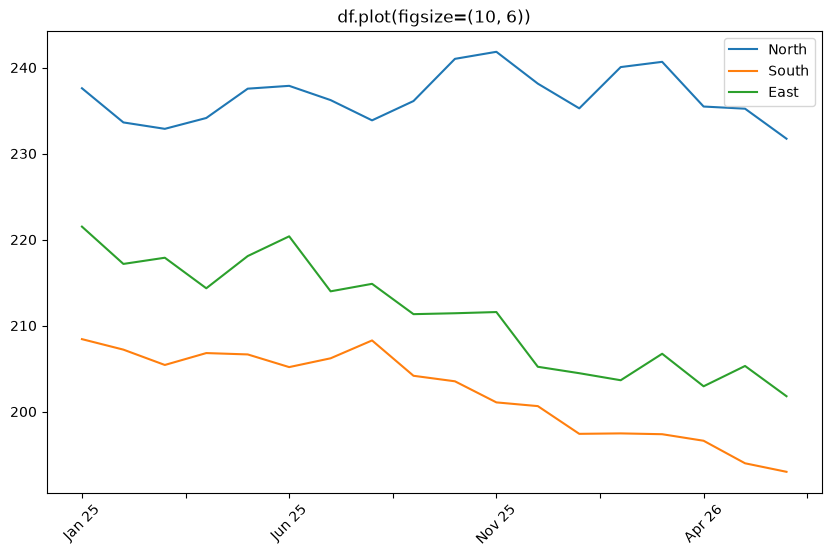
Change the figure size for Pandas df.plot() charts with figsize, plt.subplots, and rcParams.