
Python
How to Downsample Large Time Series Data for Fast Visualization
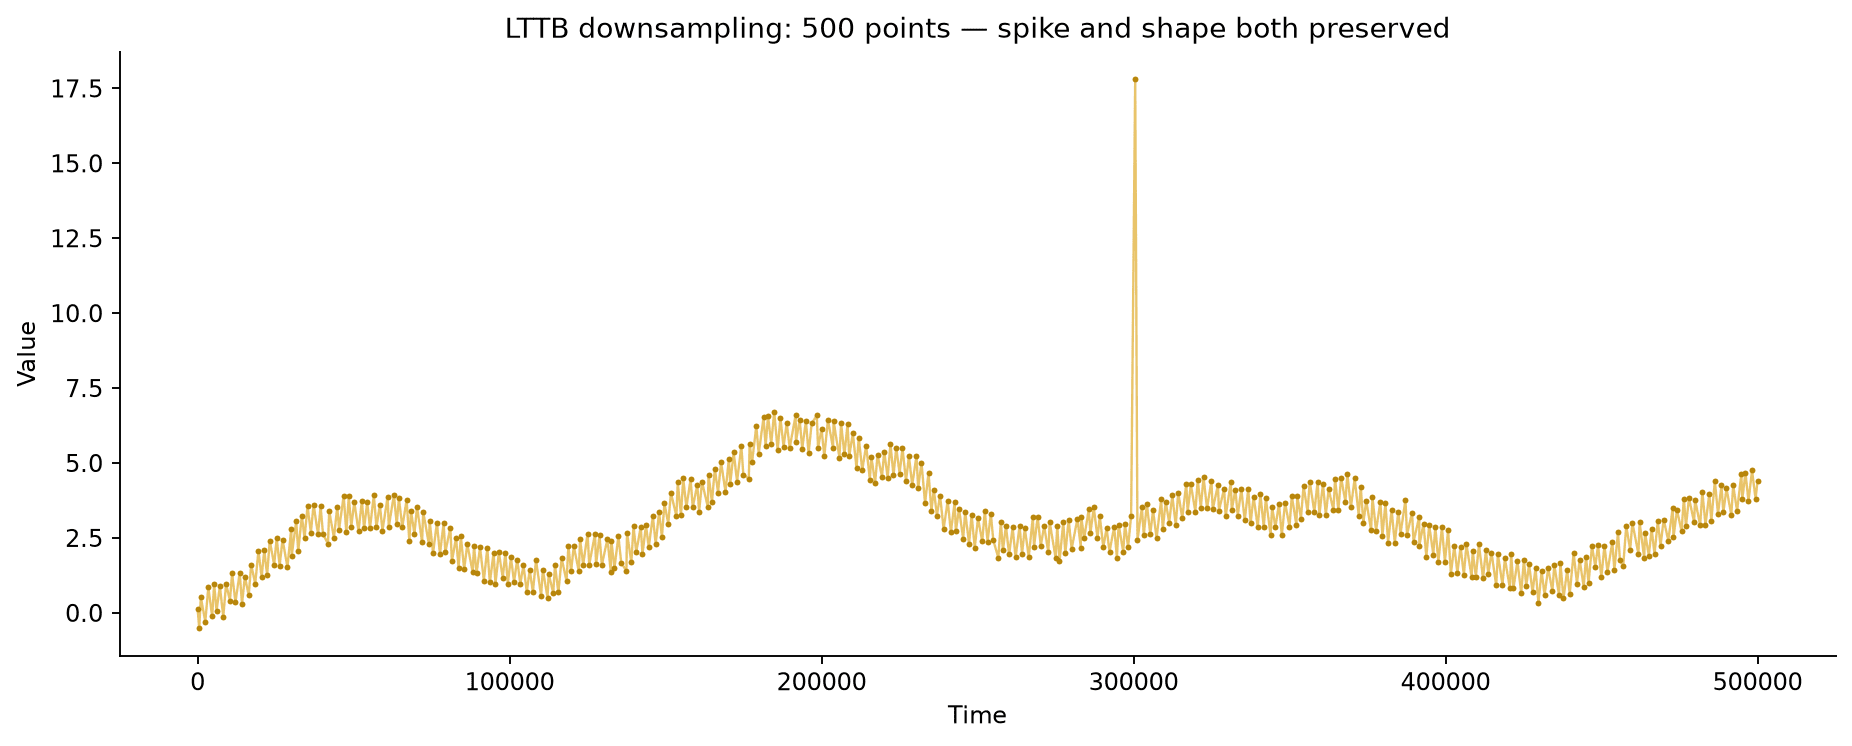
Downsample large time series data in Python for fast plotting without losing spikes or overall shape, comparing naive decimation, min/max envelopes, and LTTB.
Downsample large time series data in Python for fast plotting without losing spikes or overall shape, comparing naive decimation, min/max envelopes, and LTTB.
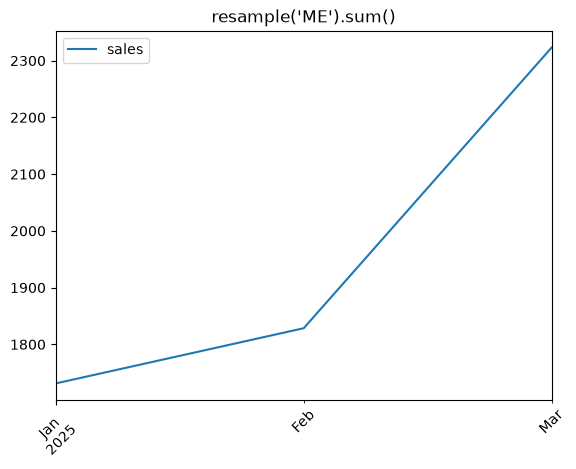
Resample time series data to a custom frequency in Pandas and plot the result with df.plot.
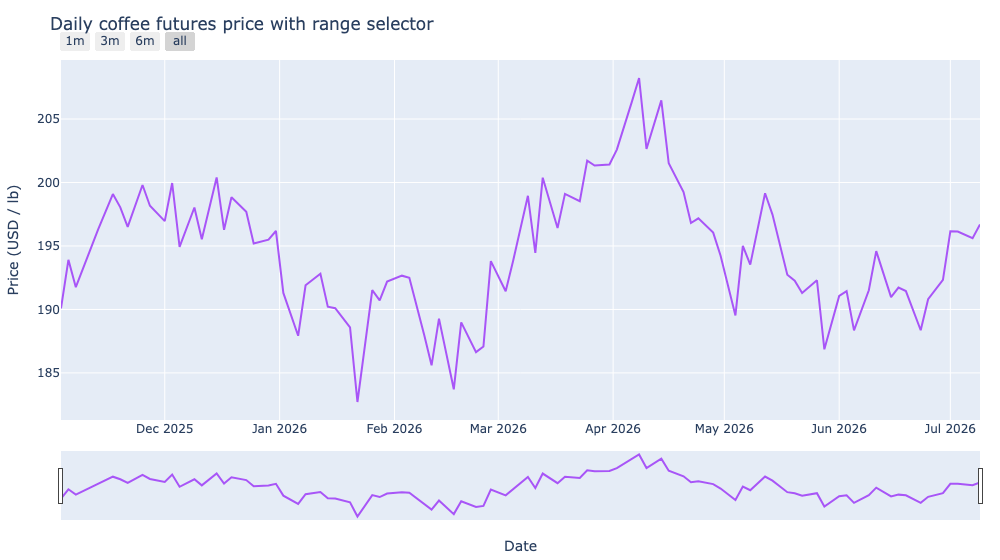
Add range sliders and selector buttons to a time series in Plotly to make long histories scrubbable.