
df.plot() is a quick way to chart a DataFrame, but the default figure size is small and often cropped. The good news is that Pandas plotting wraps Matplotlib, so every Matplotlib figure-size trick works on it.
Quick Example
Pass figsize=(width, height) straight to df.plot(). Sizes are in inches.
import pandas as pd

df.plot(figsize=(10, 6))
The figsize argument appears on every Pandas plotting method, from df.plot.line() to df.plot.bar(), ss.plot.hist(), and the rest.
The figsize argument
The most direct approach is the figsize keyword on df.plot(). A (10, 6) figure gives the axes enough room for readable labels and a legend without spilling over.
ax = df.plot(figsize=(10, 6))
Compare the small default with the sized-up version:
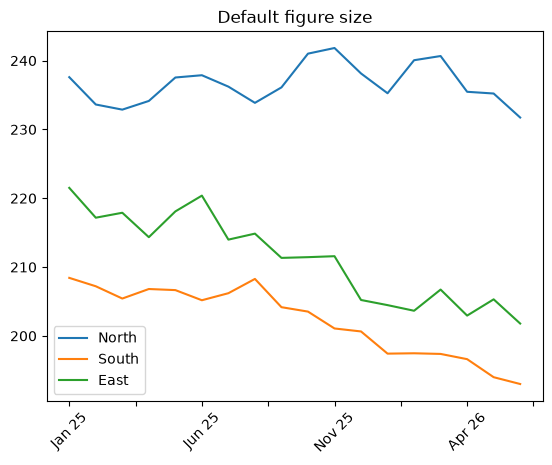
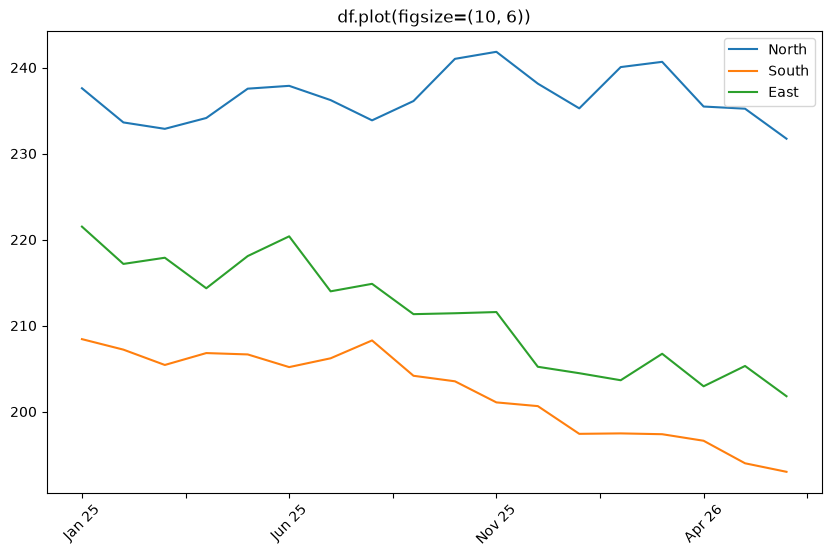
Pandas passes figsize through to Matplotlib, so the value is always a (width, height) tuple in inches.
Size a plot you create yourself
If you build the figure first, set the size there and hand the axes to df.plot(). This is the pattern to use when a notebook already has a Matplotlib figure you want to reuse.
import matplotlib.pyplot as plt

fig, ax = plt.subplots(figsize=(10, 6))
df.plot(ax=ax)
Passing ax=ax tells Pandas to draw into your pre-sized axes instead of creating its own. The figsize then lives in one place: the plt.subplots() call.
Resize subplots
For a stacked set of charts, Pandas splits the axes with subplots=True, and figsize controls the whole grid while layout controls its shape.
df.plot(
    subplots=True,
    figsize=(9, 8),
    layout=(2, 2),
    sharex=True,
)
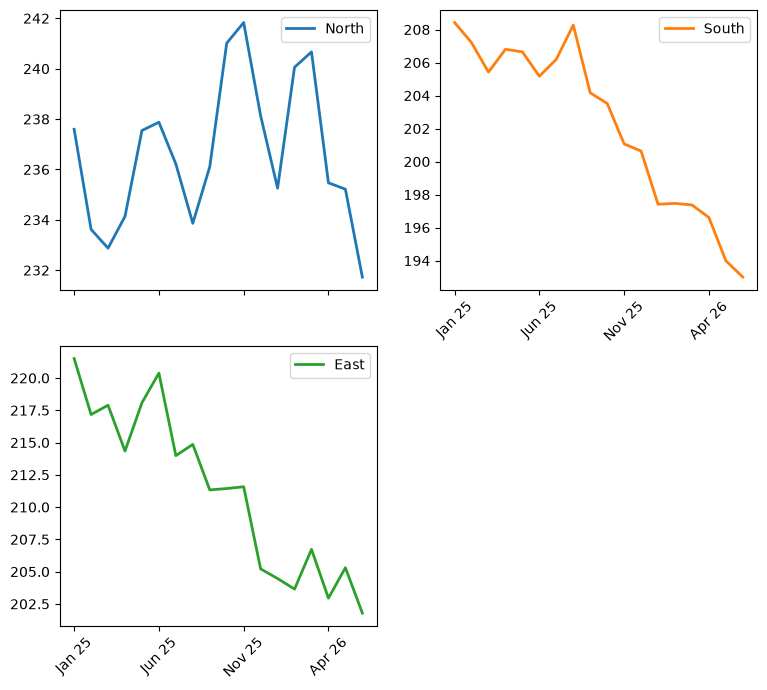
The single figsize sizes the entire canvas of panels. Count the number of columns in your DataFrame and pick a layout that fits them reasonably.
Set a global default with rcParams
To make every figure in a script the same size without repeating figsize, set Matplotlib's default once at the top.
import matplotlib.pyplot as plt

plt.rcParams["figure.figsize"] = (10, 6)

df.plot()
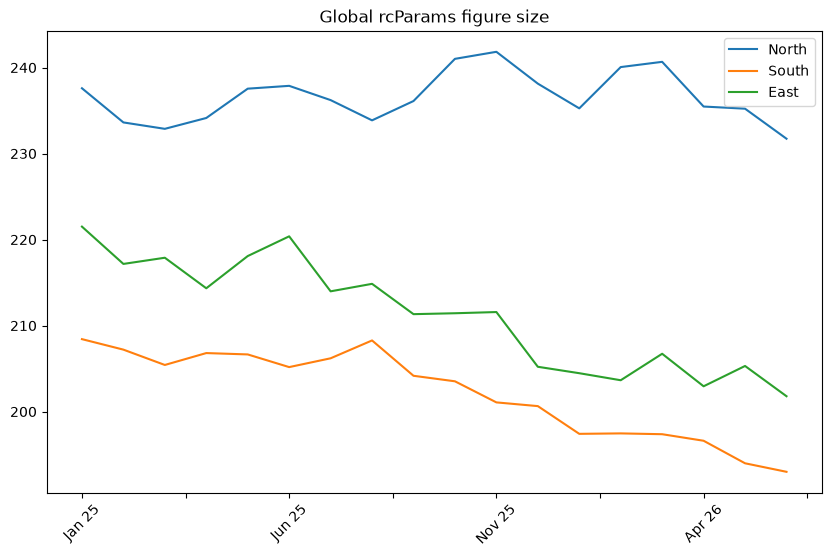
Setting plt.rcParams["figure.figsize"] changes the default for all subsequent figures, including every df.plot() that does not pass its own figsize. Any explicit figsize argument still overrides it.
Practical Tips
- Use
df.plot(figsize=(w, h))for a quick, one-off resize. - Build the figure with
plt.subplots(figsize=...)and passax=axwhen you want full control or reuse. - Set
plt.rcParams["figure.figsize"]once when every chart should share the same size. - Combine
subplots=Truewithfigsizeandlayoutto size a grid of panels. - Use
bbox_inches="tight"when saving so rotated or long labels are not clipped.