
TL;DR
Call fig.tight_layout() after adding your subplots, titles, and labels:
import matplotlib.pyplot as plt

fig, axes = plt.subplots(2, 2)

for ax in axes.flat:
    ax.plot([1, 2, 3], [2, 1, 3])
    ax.set_title("A subplot title")
    ax.set_xlabel("X-axis label")
    ax.set_ylabel("Y-axis label")

fig.tight_layout()
plt.show()
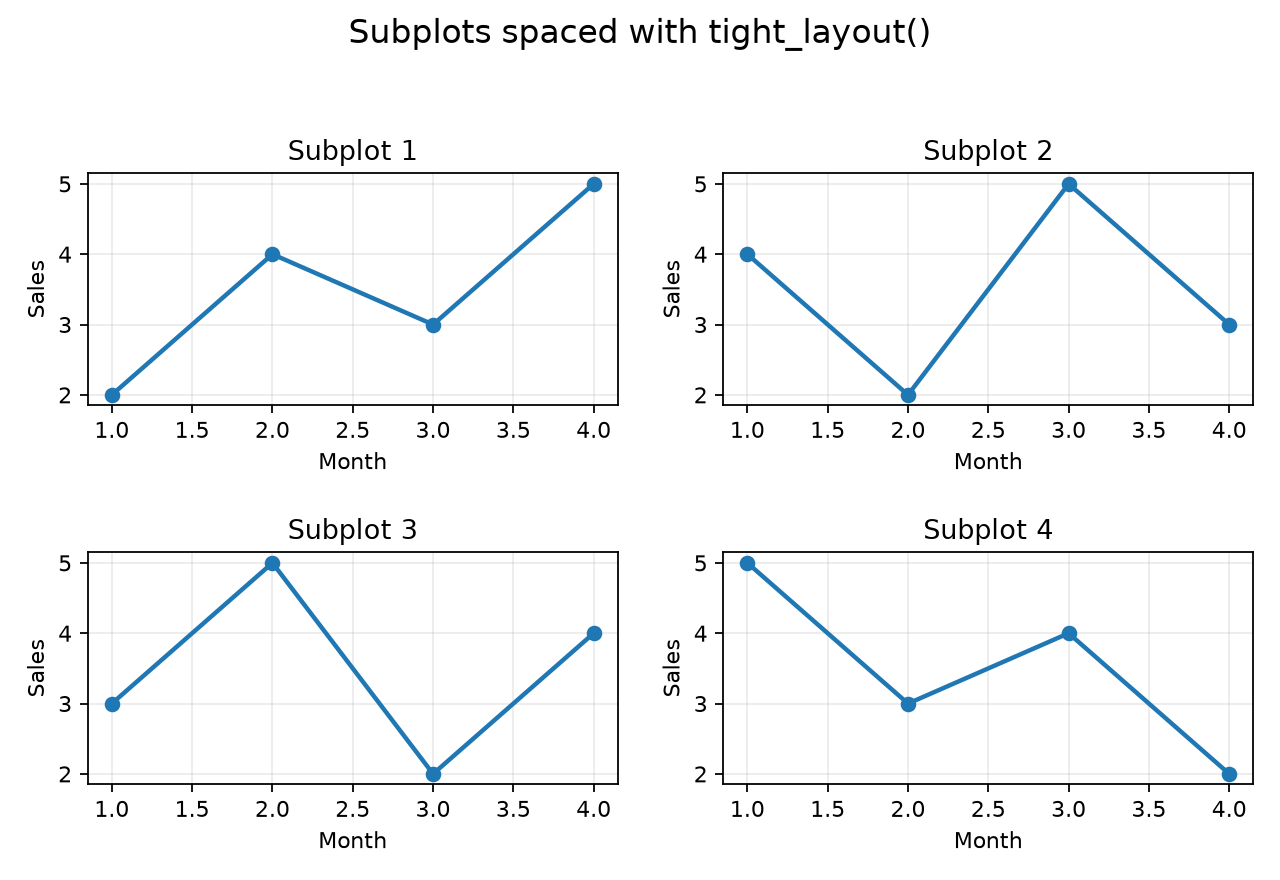
tight_layout() automatically adjusts the subplot margins and gaps so labels do not overlap or get clipped.
Add More Padding
Use pad to add space around the outside of the figure. w_pad and h_pad control the gaps between columns and rows:
fig.tight_layout(pad=2, w_pad=2, h_pad=2)
These values are fractions of the font size, so a larger number creates more space.
Leave Space for a Figure Title
If you use fig.suptitle(), reserve room at the top with rect:
fig.suptitle("Quarterly results")
fig.tight_layout(rect=[0, 0, 1, 0.95])
The four values are the left, bottom, right, and top boundaries of the area used for subplots.
plt.tight_layout() is the pyplot equivalent when you do not need the figure object.