
TL;DR
Use Plotly's chart config to hide the floating modebar, or adjust layout options to keep the toolbar hidden until hover.
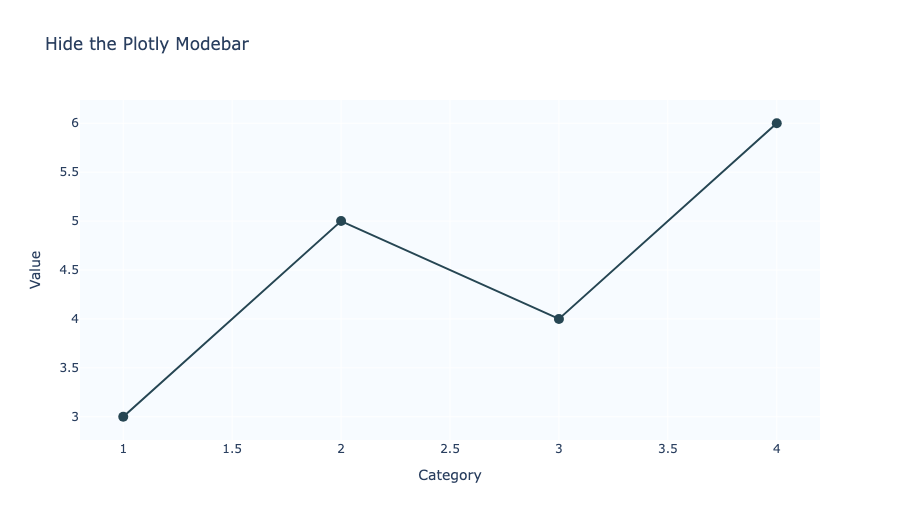
What is the Plotly modebar?
The Plotly modebar is the small floating toolbar that appears in the top-right corner of every interactive chart. It contains buttons for zoom, pan, download, and other interactions.
Hide the modebar completely
The simplest way to remove the modebar is with config.displayModeBar=False.
import plotly.graph_objects as go

fig = go.Figure(data=[go.Scatter(x=[1, 2, 3], y=[2, 4, 3])])
fig.show(config=dict(displayModeBar=False))
Show the modebar only on hover
If you want the toolbar to remain hidden until the user hovers over the chart, use config.displayModeBar='hover'.
import plotly.graph_objects as go

fig = go.Figure(data=[go.Scatter(x=[1, 2, 3], y=[2, 4, 3])])
fig.show(config=dict(displayModeBar='hover'))
Use layout.modebar for more control
Plotly also exposes layout-level modebar options, including hiding specific buttons.
import plotly.graph_objects as go

fig = go.Figure(data=[go.Scatter(x=[1, 2, 3], y=[2, 4, 3])])
fig.update_layout(modebar=dict(remove=['zoom2d', 'pan2d']))
fig.show()
Recommended setting
For a clean embedded chart with no persistent toolbar, use:
fig.show(config=dict(displayModeBar=False))
This keeps the chart interactive while removing the floating toolbar entirely.