
Altair
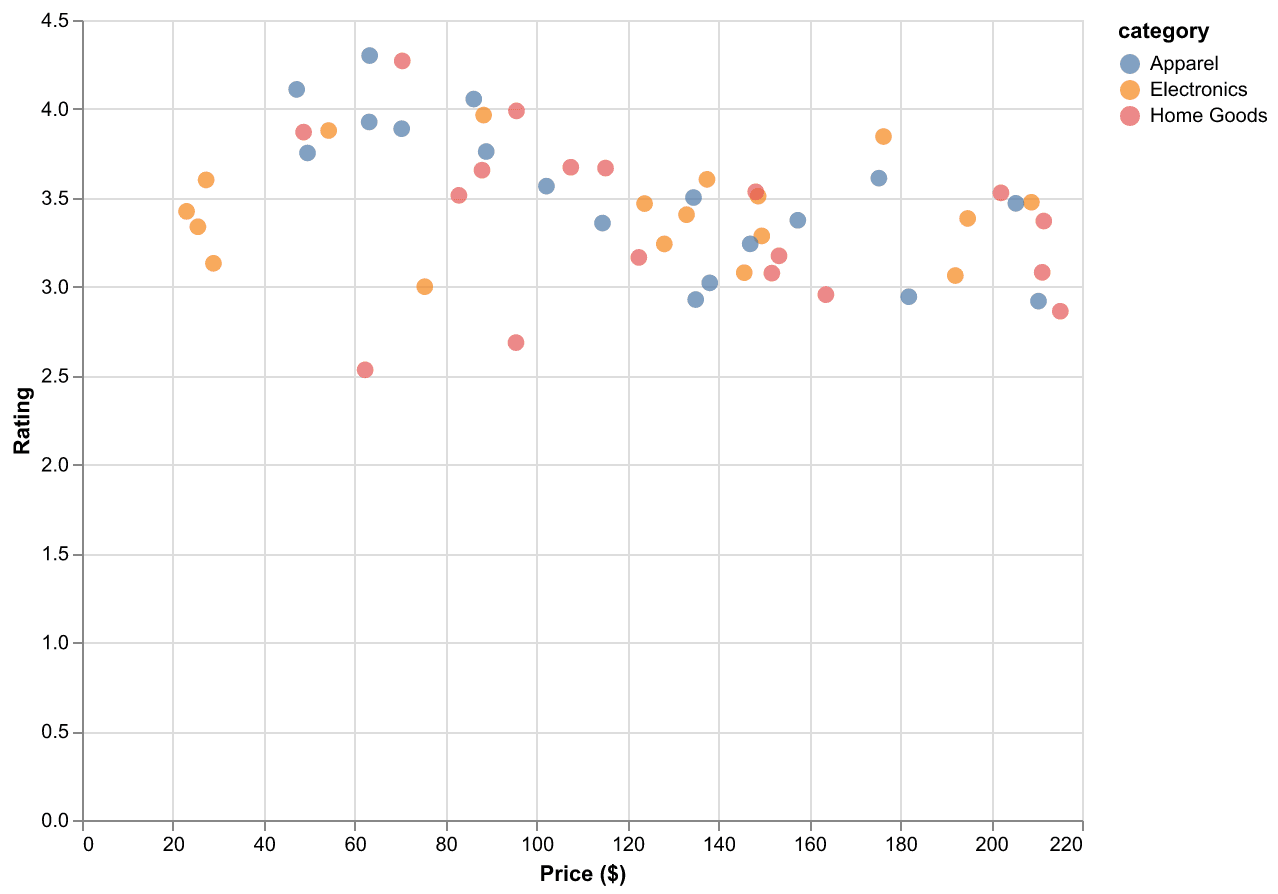
Add Interactive Tooltips to Altair Scatter Plots
Add and customize hover tooltips on Altair scatter plots, including formatting values and showing computed fields.
Add and customize hover tooltips on Altair scatter plots, including formatting values and showing computed fields.
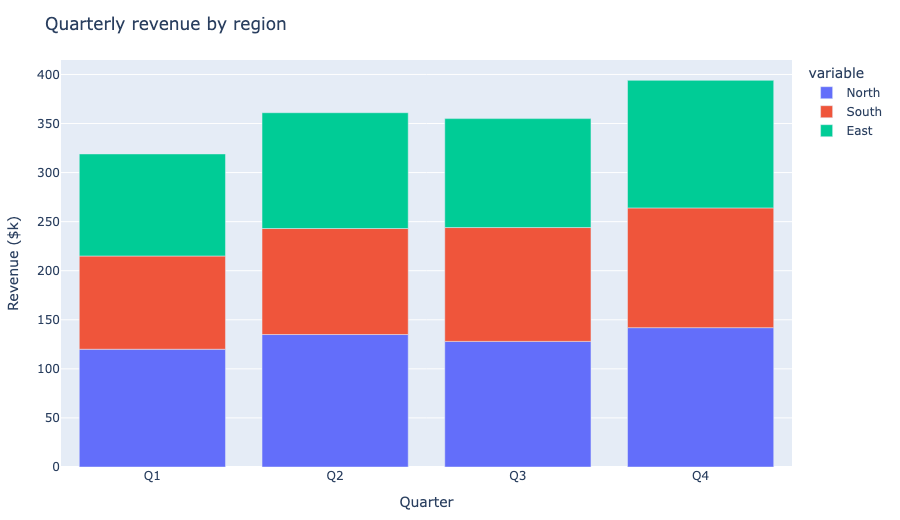
Switch the Pandas default plotting backend to Plotly so df.plot() returns interactive figures.
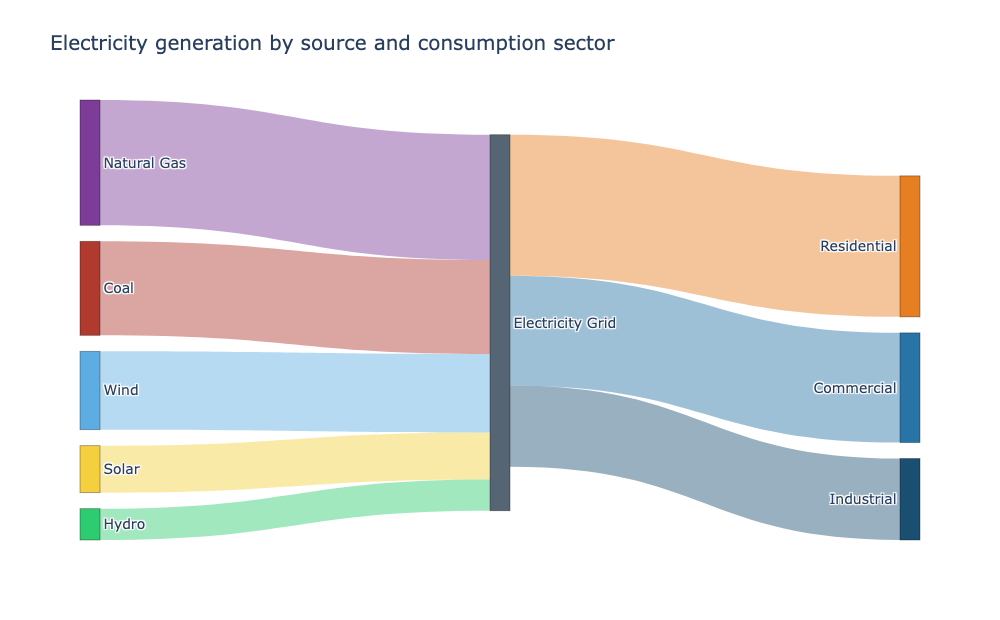
Build interactive Sankey diagrams in Plotly to trace flows between nodes.
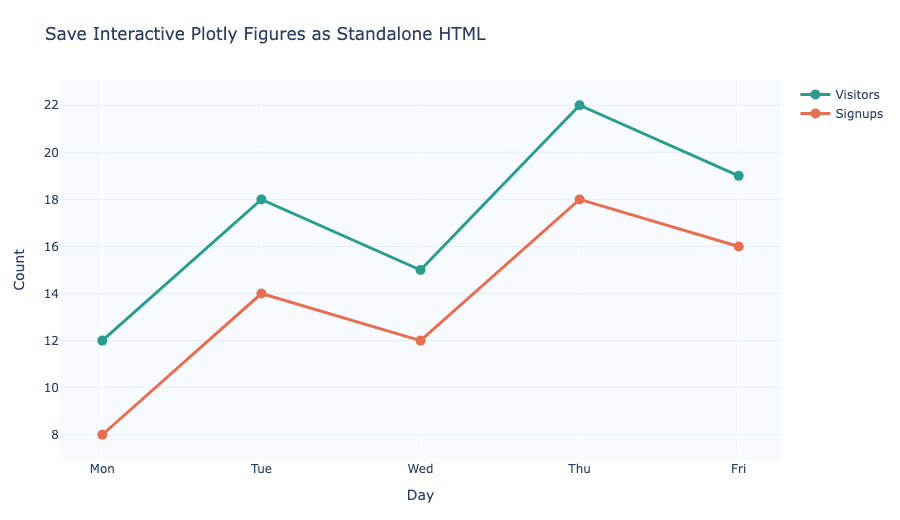
Save Plotly figures as standalone HTML files for interactive sharing and offline viewing.
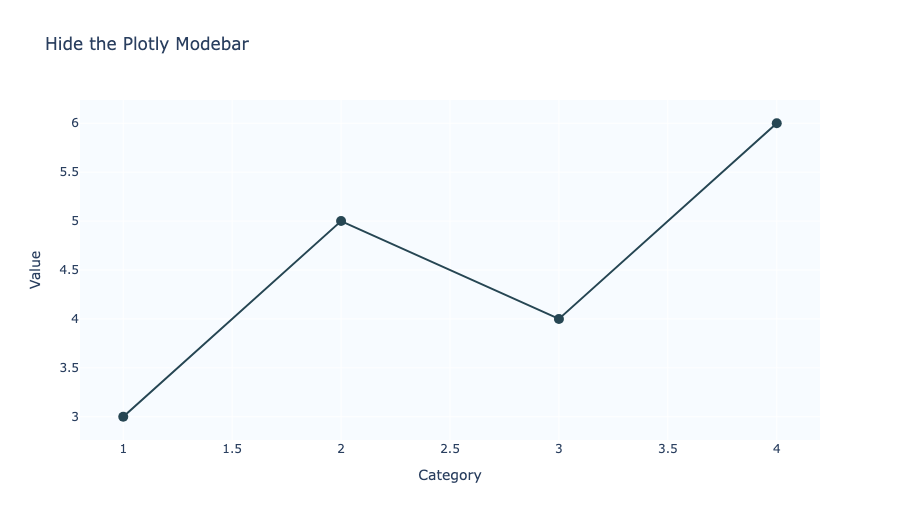
Hide Plotly's modebar toolbar using config.displayModeBar or layout.modebar settings.