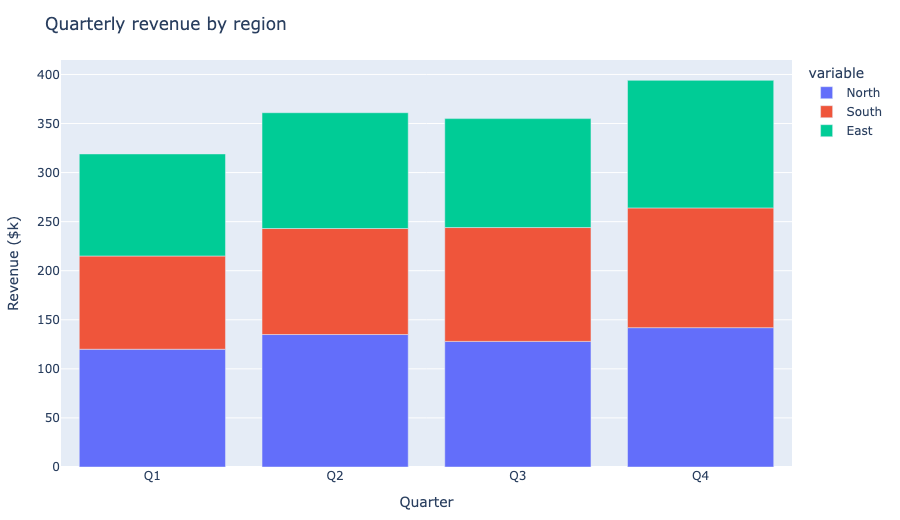
By default df.plot() renders a static Matplotlib chart. Pandas lets you swap in Plotly as the backend, so the same df.plot() call returns an interactive figure with hover, zoom, and pan, without rewriting your code.
Quick Example
Set the backend once and every df.plot() call from then on uses Plotly.
import pandas as pd

pd.options.plotting.backend = "plotly"

df.plot()
Now df.plot() returns a Plotly Figure instead of a Matplotlib axes. In a notebook, fig.show() renders it interactive; on this site, the result is embedded directly as HTML.
Install what you need
The Plotly backend ships with pandas as long as plotly is installed. Nothing extra is imported, because pandas loads the backend lazily when you switch.
pip install plotly
To save static images of the figures, also install kaleido. It is optional and only needed for exporting PNGs, not for the interactive charts themselves.
Switch the backend globally
Set the option once at the top of your script or notebook to apply it to every df.plot() call.
import pandas as pd

pd.options.plotting.backend = "plotly"

# Returns a Plotly figure, not Matplotlib axes.
fig = df.plot(kind="bar")
The embedded group chart above was built this way: a plain df.plot(kind="bar") after the switch, with a couple of update_layout() calls for titles and size.
Switch it for a single call
When you only want one interactive chart, pass backend="plotly" to that call instead of changing the global default.
fig = df.plot(backend="plotly", kind="line")
The rest of your charts keep using Matplotlib. This is handy when migrating gradually or when most plots should stay static.
What changes about the result
The return value is now a Plotly Figure, not a Matplotlib Axes. That changes how you finish the chart:
fig.show()                       # render it in a notebook
fig.update_layout(title="...")   # style titles, margins, size
fig.write_image("plot.png")      # export a still with kaleido
Arguments that are Matplotlib-specific, like figsize, no longer apply. Use Plotly's width and height on the returned figure instead.
Which kinds are supported
The kind argument still drives the chart picker, so kind="bar", "line", "area", "pie", "scatter", and "hist" all work through the backend. Grouped bars from a hue-style DataFrame and multi-column lines behave the same way, but the output is interactive.
Revert to the default
To go back to static Matplotlib output, reset the backend to the default.
pd.options.plotting.backend = "matplotlib"
You can also force a single static plot with df.plot(backend="matplotlib"). The global option only lives for the current process, so a fresh kernel starts back on Matplotlib unless you set it again.
Practical Tips
- Set
pd.options.plotting.backend = "plotly"once for an all-interactive workflow. - Use
df.plot(backend="plotly")per call when you want only some charts interactive. - Style the returned figure with
fig.update_layout(...);figsizeno longer works. - Install
kaleidoonly if you need to export static PNGs. - Reset with
pd.options.plotting.backend = "matplotlib"to go back to static charts.