
Altair charts are built on Vega-Lite, and tooltips are just another encoding channel, the same way x, y, and color are. That makes them genuinely easy to add: no separate hover-handling code, no JavaScript, just one more argument to encode().
Quick Example
Pass a list of column names to tooltip, and every point shows those fields on hover automatically.
import altair as alt

alt.Chart(df).mark_circle(size=70).encode(
    x="price:Q",
    y="rating:Q",
    color="category:N",
    tooltip=["product", "category", "price", "rating", "units_sold"],
)
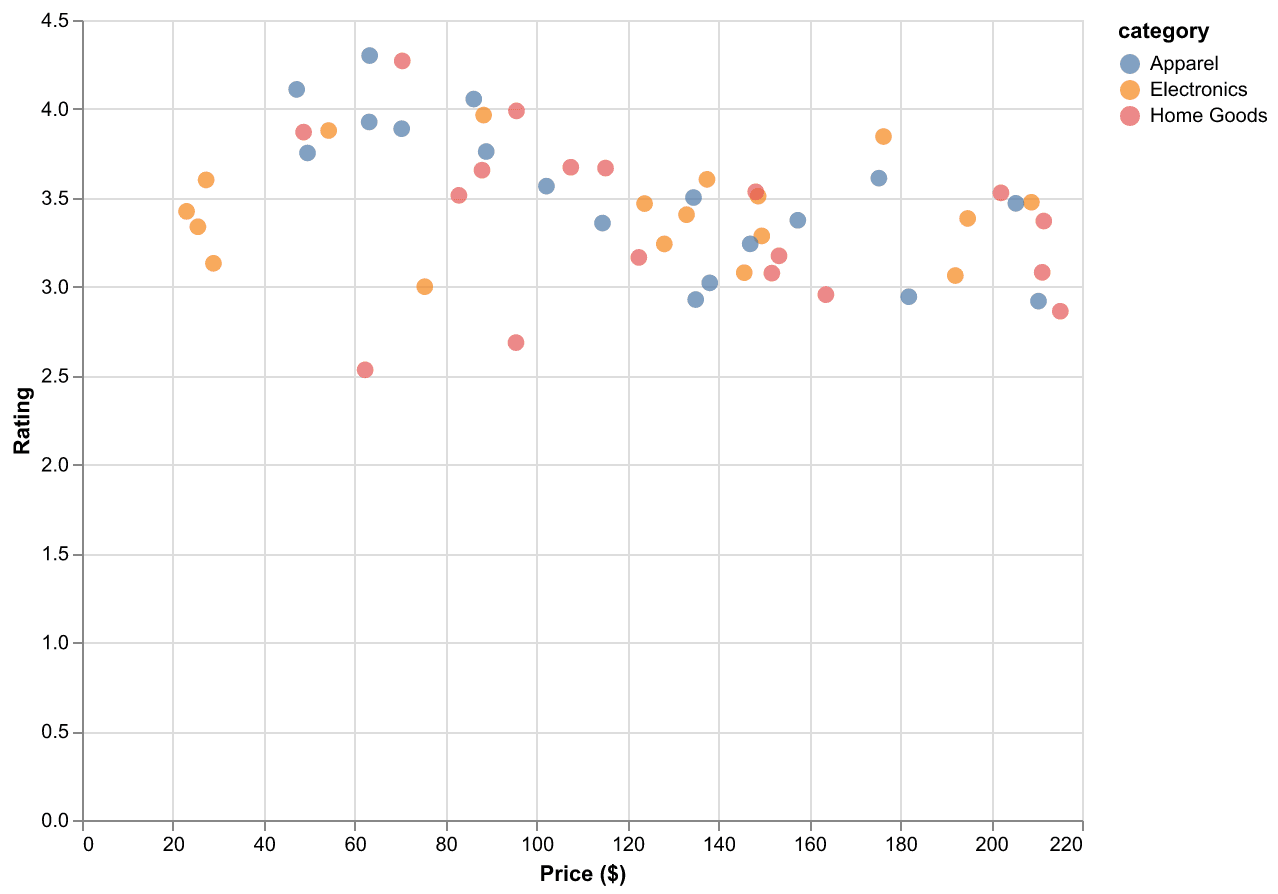
The tooltip list doesn't have to match what's already mapped to x, y, or color; it's an independent channel, so it's the natural place to surface fields (like product and units_sold here) that inform the point without needing their own visual encoding.
Formatting values and adding titles
Plain column names in tooltip show up with their raw field name and raw value, which is rarely how you'd want a price or a rating displayed. Swap a string for alt.Tooltip() to control both.
tooltip=[
    alt.Tooltip("product", title="Product"),
    alt.Tooltip("category", title="Category"),
    alt.Tooltip("price:Q", title="Price", format="$.2f"),
    alt.Tooltip("rating:Q", title="Rating", format=".1f"),
    alt.Tooltip("units_sold:Q", title="Units Sold", format=","),
]
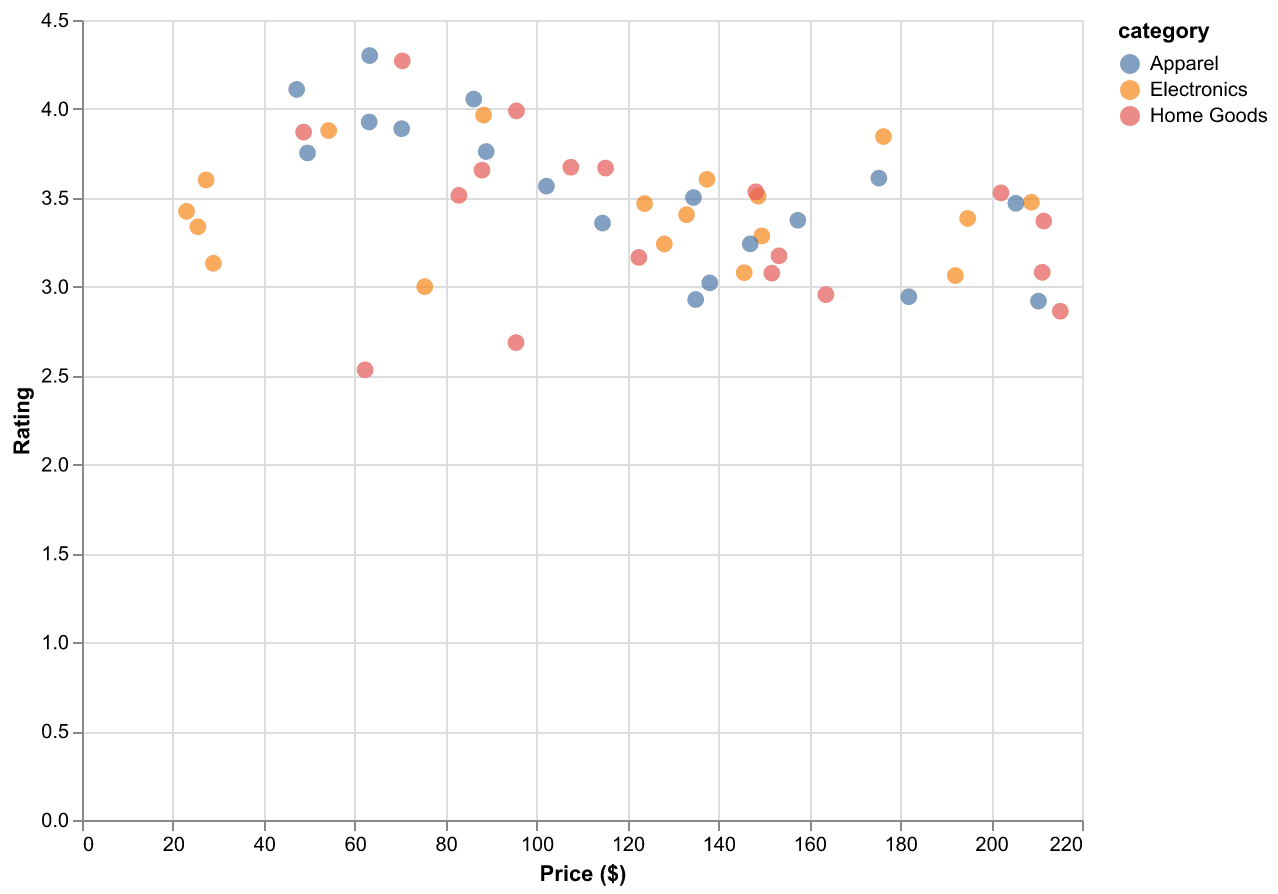
title replaces the raw field name with readable label text, and format takes a d3-format string: "$.2f" for currency, "," for thousands separators, ".1f" for a fixed decimal place. The :Q type suffix matters here too; Altair needs to know a field is quantitative to apply a numeric format string to it correctly.
Showing a computed field
A tooltip isn't limited to columns that already exist in the DataFrame. transform_calculate can derive a new field first, and that field is available to tooltip (or any other encoding) just like a real column.
alt.Chart(df).transform_calculate(
    revenue="datum.price * datum.units_sold"
).mark_circle().encode(
    x="price:Q",
    y="rating:Q",
    size="revenue:Q",
    color="category:N",
    tooltip=[
        alt.Tooltip("product", title="Product"),
        alt.Tooltip("price:Q", title="Price", format="$.2f"),
        alt.Tooltip("units_sold:Q", title="Units Sold", format=","),
        alt.Tooltip("revenue:Q", title="Revenue", format="$,.0f"),
    ],
)
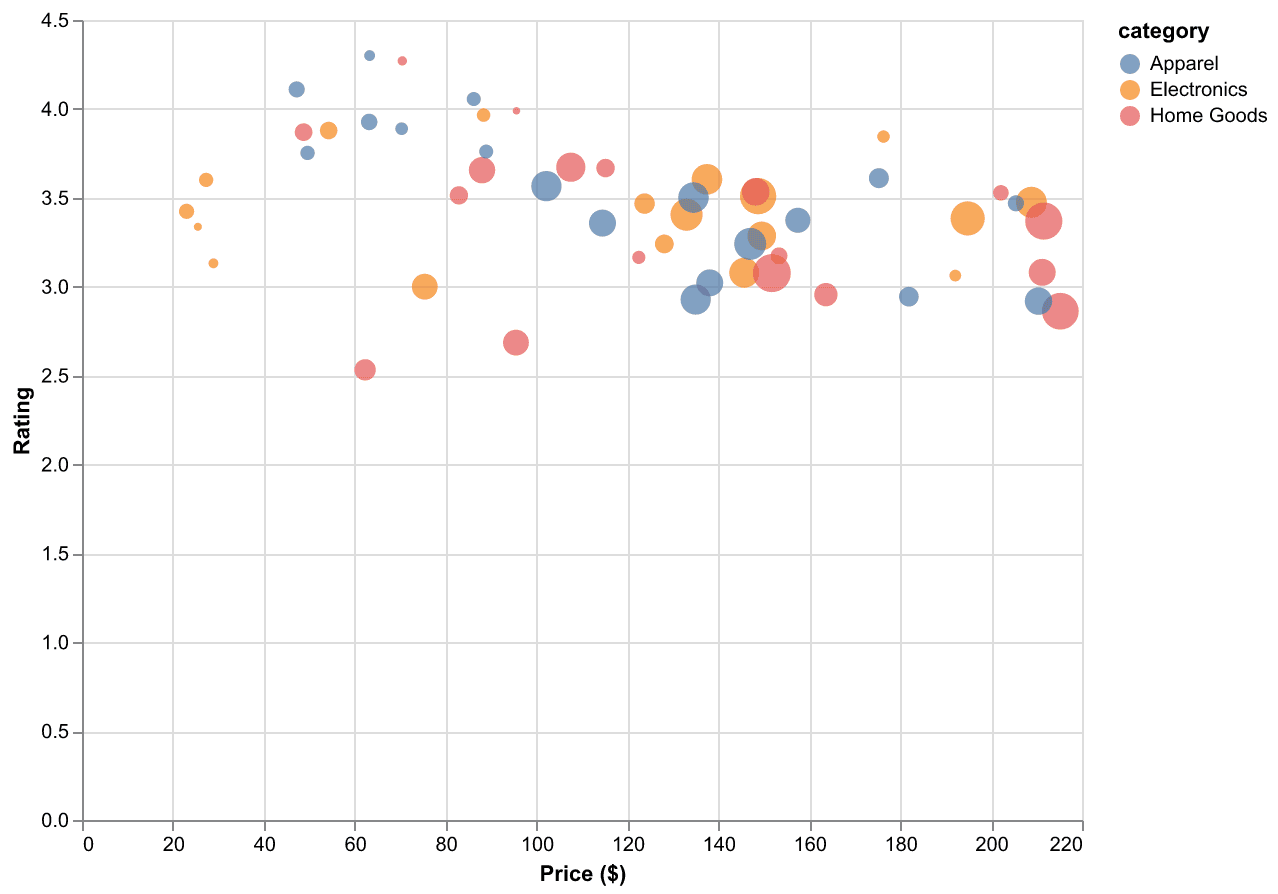
datum inside the transform_calculate expression refers to each row as Vega-Lite processes it; datum.price * datum.units_sold is plain JavaScript-style expression syntax, not Python, since it's evaluated inside the rendered chart, not by Altair itself. Reusing revenue for both size and tooltip here means the field driving the largest points on the chart is also the exact number a reader can confirm by hovering over one.
Practical Tips
tooltipis independent ofx,y, andcolor; use it to surface identifying or contextual fields (like a name or ID) that don't need their own visual channel.- Always add a
:Q/:N/:O/:Ttype suffix on fields passed toalt.Tooltip(..., format=...); a missing or wrong type is the most common reason a format string silently doesn't apply. formatstrings follow d3-format syntax:.2f(2 decimals),$.2f(currency),,(thousands separator),.0%(percentage). These compose, e.g."$,.0f"for whole-dollar amounts with thousands separators.- Fields computed with
transform_calculatework intooltipexactly like real columns; this is the way to show a derived value (a rate, a total, a difference) without adding it to the DataFrame beforehand. - Tooltips work without
.interactive(); that method only adds pan and zoom. Don't add it if all you need is hover detail.