
Overview
Altair makes it easy to export your visualizations to multiple formats. Whether you need a static image for a presentation, a scalable vector graphic for a publication, or an interactive HTML file for sharing on the web, Altair has you covered.
In this post, we'll explore the different ways to save and export your Altair charts.
Prerequisites
Before we can save charts as PNG or SVG, we need to install altair_saver, which requires a few dependencies. Let's get set up:
# Install altair with all extras
pip install altair altair_saver pandas vega_datasets

# altair_saver also requires Node.js and npm
# If you don't have Node.js installed, install it from https://nodejs.org/
Once installed, you may need to install the vega-lite and vega packages via npm:
npm install -g vega-lite vega canvas
Creating a Sample Chart
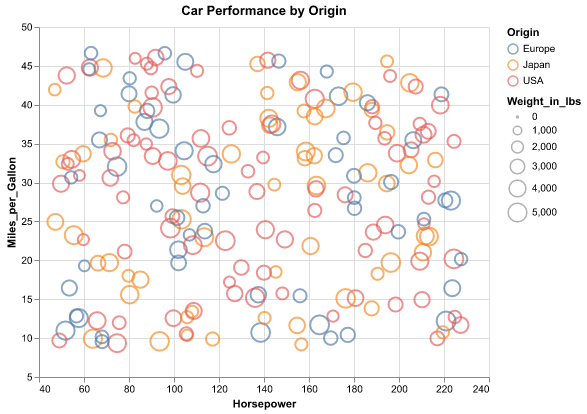
Let's start by creating a simple chart that we can save in different formats:
import altair as alt
import pandas as pd
from vega_datasets import data

# Load sample data
df = data.cars()

# Create a scatter plot
chart = alt.Chart(df).mark_point().encode(
    x='Horsepower:Q',
    y='Miles_per_Gallon:Q',
    color='Origin:N',
    size='Weight_in_lbs:Q'
).properties(
    width=400,
    height=300,
    title='Car Performance by Origin'
).interactive()

# Display the chart
chart.show()
Saving as HTML
The simplest way to save an Altair chart is as an interactive HTML file. This preserves all the interactivity of your chart and can be easily shared or embedded in web pages.
# Save as HTML
chart.save('chart.html')
This creates a standalone HTML file that can be opened in any web browser. The file is completely self-contained and includes all the necessary JavaScript libraries to render the chart interactively.
You can also specify additional options:
# Save with custom options
chart.save('chart.html', scale_factor=2.0)
Saving as PNG
To save your chart as a PNG image, use the save() method with the format parameter:
# Save as PNG
chart.save('chart.png', scale=2)
The scale parameter controls the resolution of the output image. A scale of 2 creates a 2x resolution image (default is 1). This is useful if you need a higher-quality image for printing or presentations.
# Save high-resolution PNG
chart.save('chart.png', scale=3)
PNG Considerations
- File size: PNG files can be larger than SVG files for complex visualizations
- Interactivity: PNG is a raster format, so interactivity is lost
- Scaling: High-resolution PNGs are good for printing but increase file size
- Quality: PNGs preserve exact visual rendering without any font or display issues
Saving as SVG
SVG (Scalable Vector Graphics) is an excellent format for publications, presentations, and when you need a scalable, editable format.
# Save as SVG
chart.save('chart.svg')
SVG files maintain the vector nature of your visualization, meaning they scale perfectly to any size without losing quality.
SVG Advantages
- Scalability: Scales to any size without loss of quality
- Editability: Can be edited in vector graphics programs like Adobe Illustrator or Inkscape
- File size: Usually smaller than PNG for simple charts
- Publishing: Ideal for scientific papers and publications
- Web-friendly: Can be embedded directly in HTML
Saving with Different Formats: Complete Example
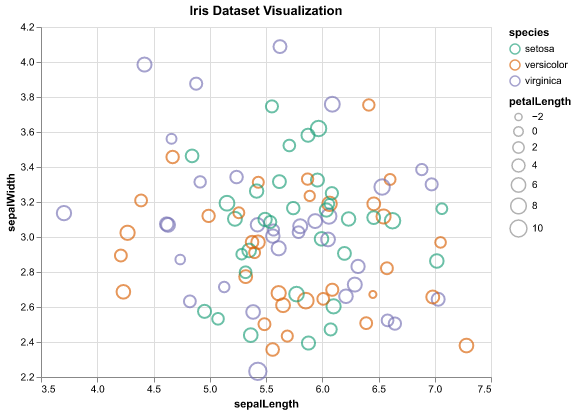
Here's a complete example showing how to save the same chart in all three formats:
import altair as alt
from vega_datasets import data

# Create a chart
df = data.iris()

chart = alt.Chart(df).mark_point().encode(
    x='sepalLength:Q',
    y='sepalWidth:Q',
    color='species:N',
    size='petalLength:Q'
).properties(
    width=500,
    height=400,
    title='Iris Dataset Visualization'
)

# Save in all formats
chart.save('iris_chart.html')
chart.save('iris_chart.png', scale=2)
chart.save('iris_chart.svg')

print("Charts saved successfully!")
print("- iris_chart.html (interactive)")
print("- iris_chart.png (raster image, 2x resolution)")
print("- iris_chart.svg (vector graphic)")
Programmatic Access to Chart Specification
Sometimes you might want to work with the chart specification directly instead of saving to a file:
# Get the chart as a dictionary
spec = chart.to_dict()

# Get the chart as JSON
json_spec = chart.to_json()

# Use the JSON in JavaScript or other applications
print(json_spec)
This is particularly useful if you're building a web application and want to pass the chart specification to a JavaScript library.
Handling Large Datasets
When working with large datasets, keep in mind that Altair charts are interactive by default. If your chart becomes too slow or unresponsive:
- Sample your data: Reduce the number of points displayed
- Aggregate data: Pre-aggregate your data before creating the chart
- Use transforms: Apply Altair's data transforms to filter or aggregate
- Disable interactivity: Remove
.interactive()if not needed
# Example: Sample large dataset
df_sample = df.sample(n=1000, random_state=42)

chart = alt.Chart(df_sample).mark_point().encode(
    x='Horsepower:Q',
    y='Miles_per_Gallon:Q'
).properties(
    width=400,
    height=300
)

chart.save('sampled_chart.html')
Troubleshooting
PNG/SVG saving requires vl-convert-python
To save Altair charts as PNG or SVG, you'll need the vl-convert-python package:
pip install vl-convert-python
Alternatively, you can use kaleido for rendering:
pip install kaleido
PNG/SVG saving fails
If you're still having issues, the required system dependencies might not be installed. Try:
# macOS
brew install node

# Ubuntu/Debian
sudo apt-get install nodejs npm

# Then install vega requirements
npm install -g vega-lite vega canvas
"vl-convert not installed" error
Make sure you have vl-convert-python installed:
pip install vl-convert-python
Summary
Altair provides flexible options for saving and sharing your visualizations:
- HTML: Best for interactive web-based sharing and presentations
- PNG: Good for static images, presentations, and reports
- SVG: Ideal for publications, printing, and when you need scalability
Each format has its strengths, and choosing the right one depends on your use case. For most workflows, you'll likely use HTML for interactive exploration and PNG/SVG for sharing static versions in documents or presentations.
Happy visualizing and exporting!