
TL;DR
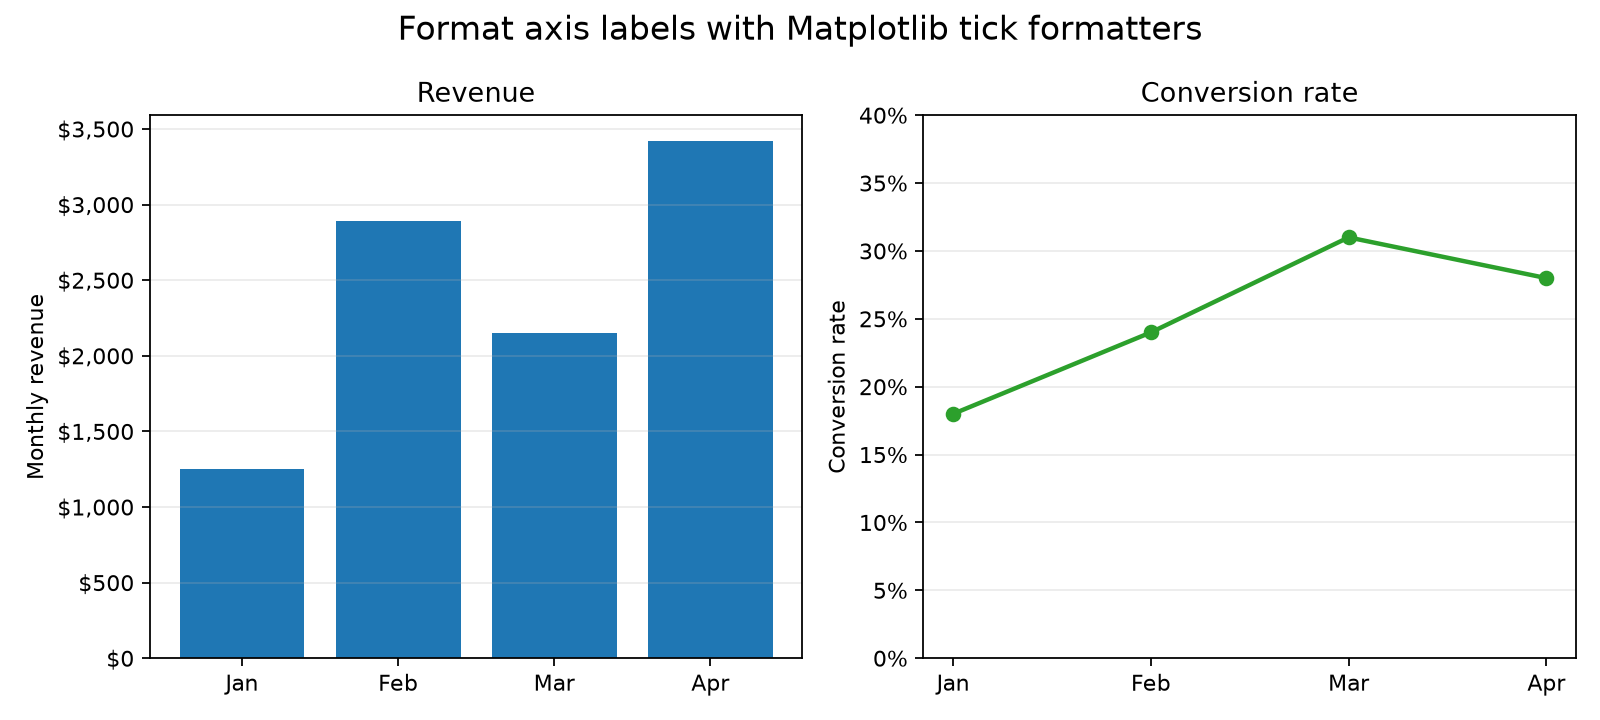
Use StrMethodFormatter for currency and PercentFormatter for percentages:
from matplotlib.ticker import PercentFormatter, StrMethodFormatter

ax.yaxis.set_major_formatter(StrMethodFormatter("${x:,.0f}"))
ax.yaxis.set_major_formatter(PercentFormatter(xmax=1, decimals=0))
The percentage formatter assumes values from 0 to 1, so 0.25 displays as 25%.
Format Currency Labels
StrMethodFormatter uses Python's format-string syntax. This version adds a dollar sign, commas, and no decimal places:
from matplotlib import pyplot as plt
from matplotlib.ticker import StrMethodFormatter

fig, ax = plt.subplots()
ax.bar(["Jan", "Feb", "Mar"], [1250, 2890, 2150])
ax.yaxis.set_major_formatter(StrMethodFormatter("${x:,.0f}"))
plt.show()
For cents, use "${x:,.2f}" instead.
Format Percentage Labels
For data stored as fractions between 0 and 1, use PercentFormatter:
from matplotlib.ticker import PercentFormatter

ax.plot(["Jan", "Feb", "Mar"], [0.18, 0.24, 0.31])
ax.yaxis.set_major_formatter(PercentFormatter(xmax=1, decimals=0))
If your data already runs from 0 to 100, set xmax=100 instead:
ax.yaxis.set_major_formatter(PercentFormatter(xmax=100))