
Seaborn
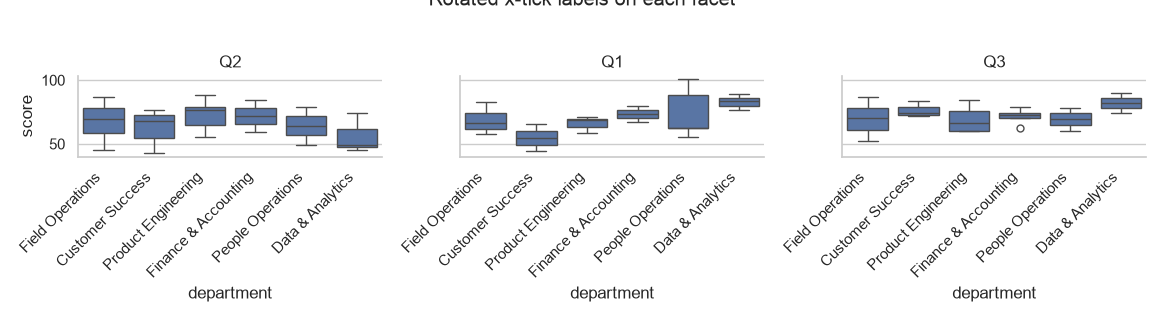
How to Rotate Labels on Seaborn FacetGrid and pairplot
Rotate tick labels on Seaborn FacetGrid and pairplot figures with set_xticklabels and a small loop.
Rotate tick labels on Seaborn FacetGrid and pairplot figures with set_xticklabels and a small loop.
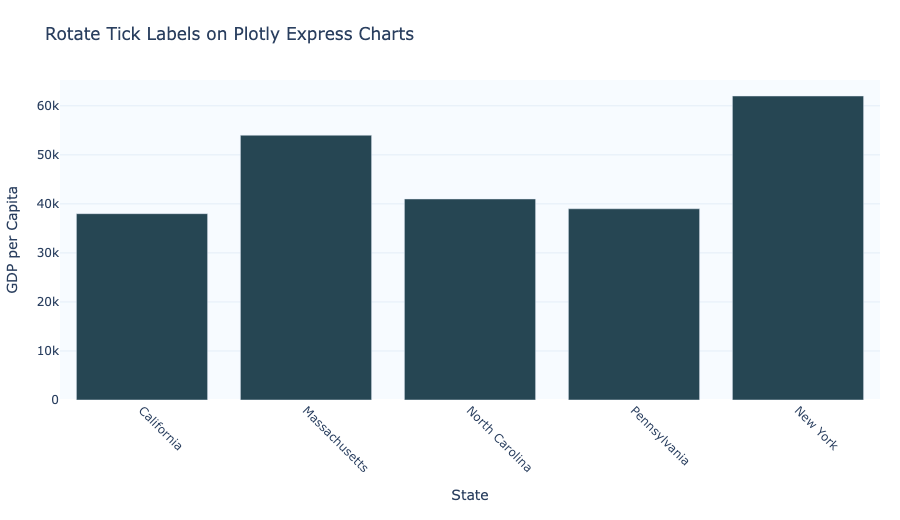
Rotate tick labels in Plotly Express charts to keep axis values readable and avoid overlap.
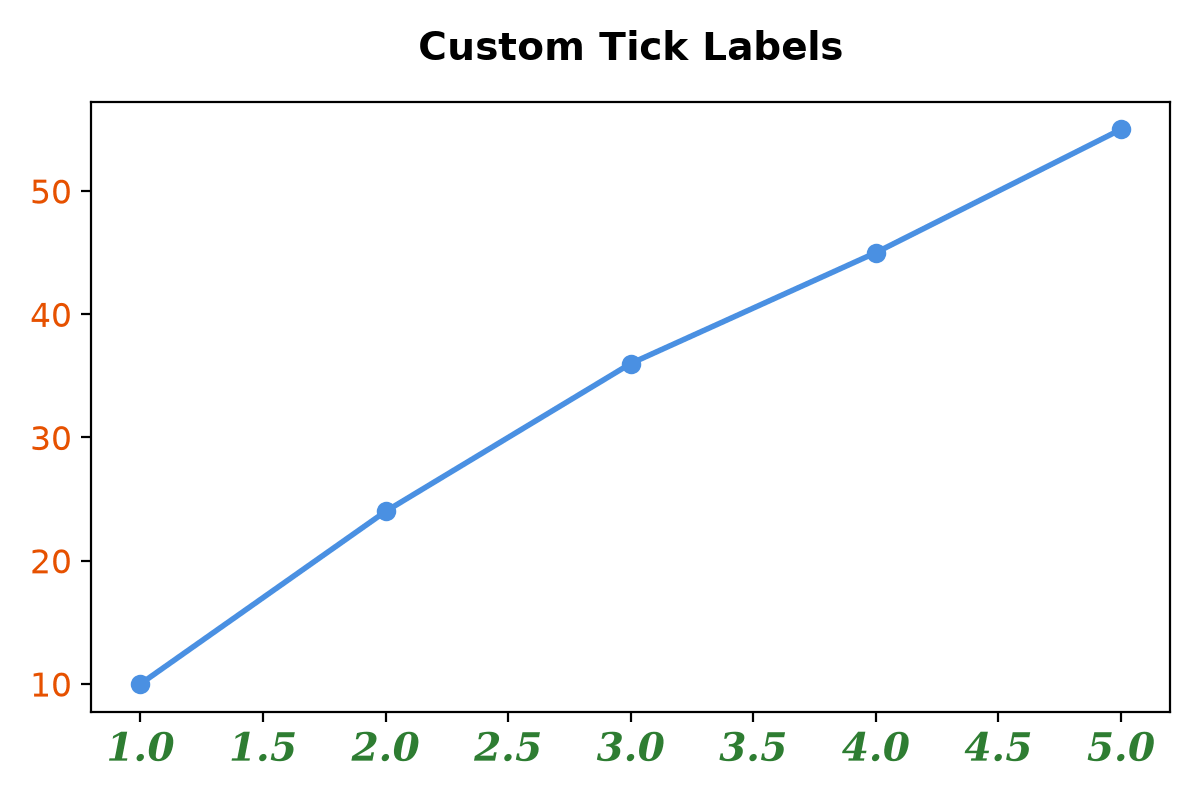
Quick guide to changing the size, weight, color, and font style of tick labels in Matplotlib.
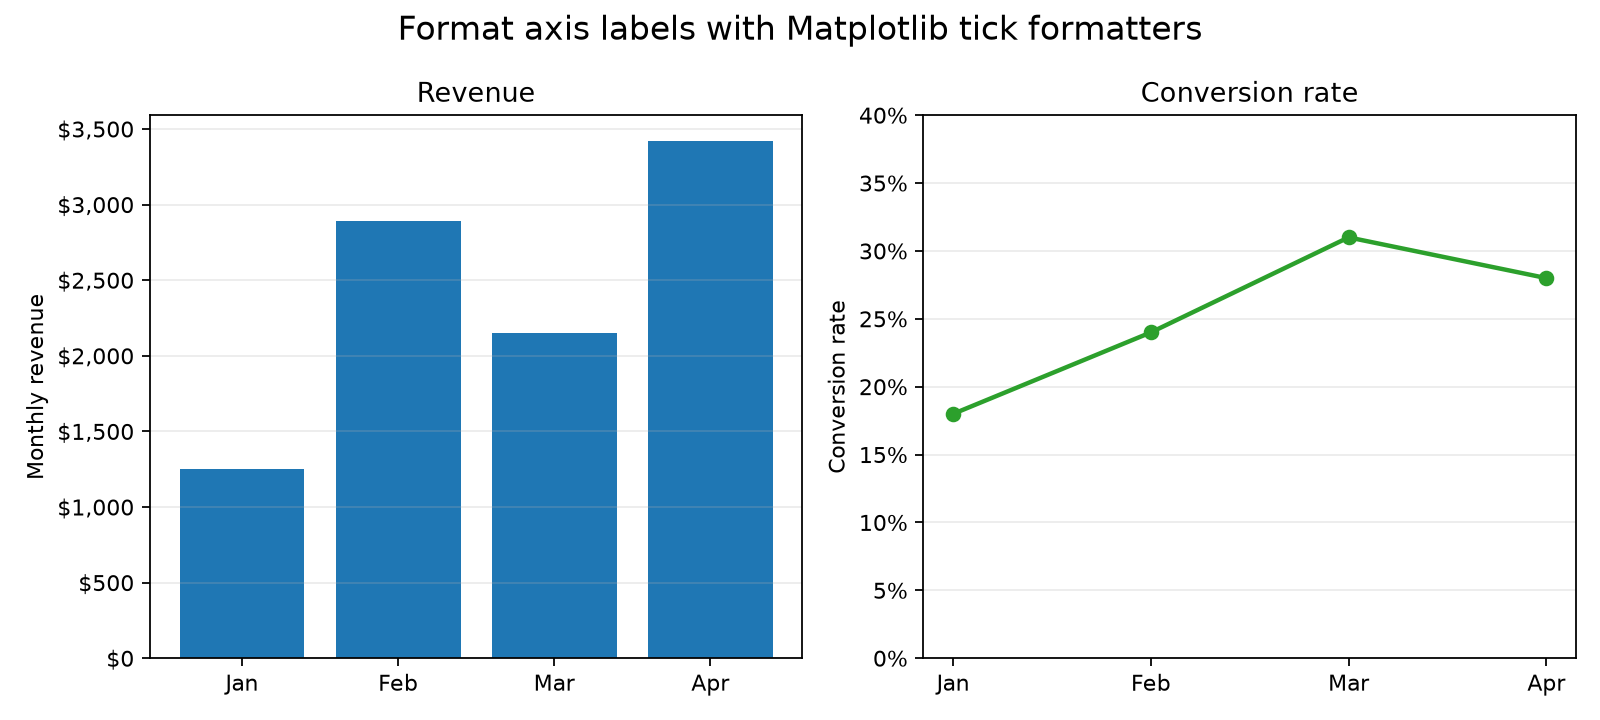
Format Matplotlib axis tick labels as currency or percentages.
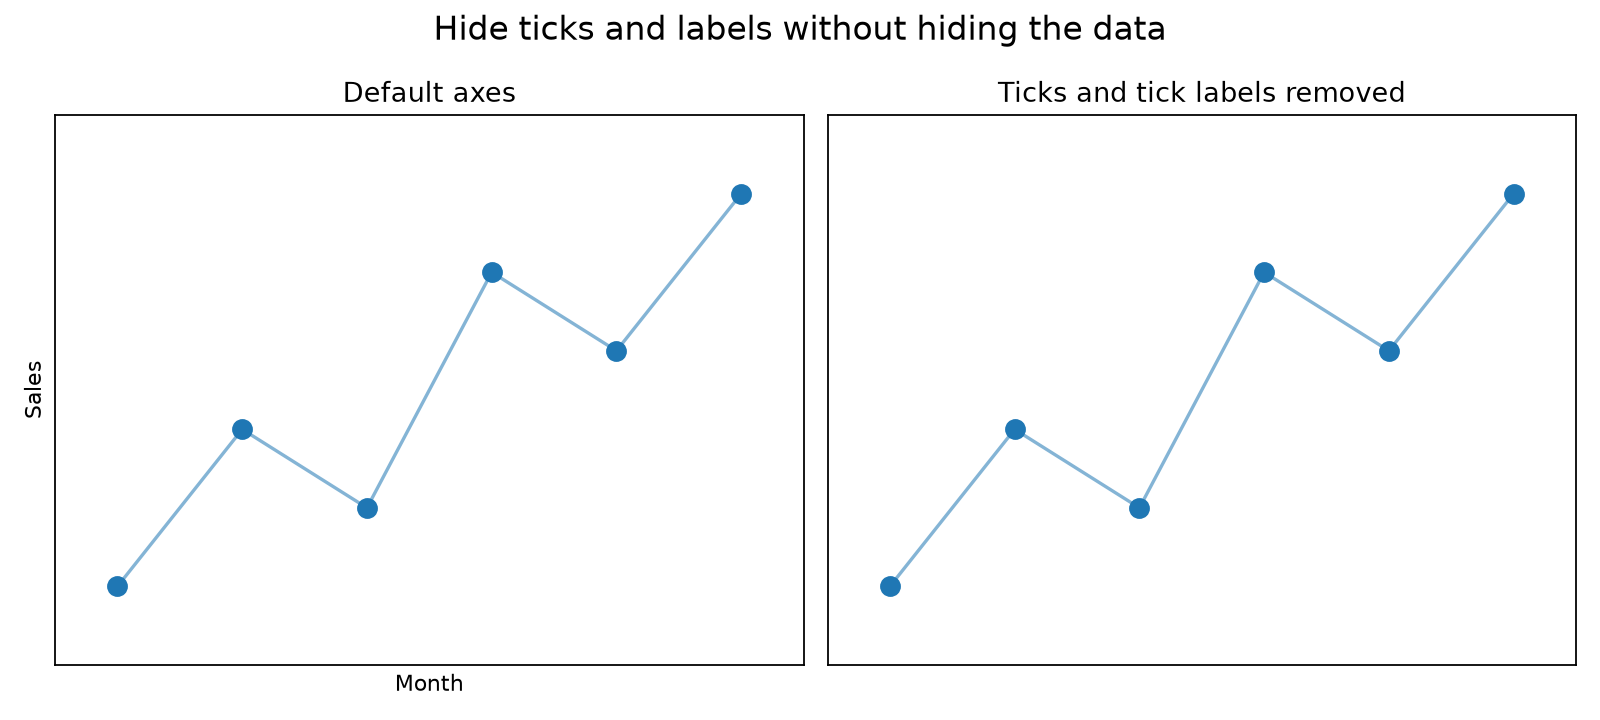
Hide axis ticks, tick labels, axis labels, or an entire Matplotlib axis.