
Seaborn
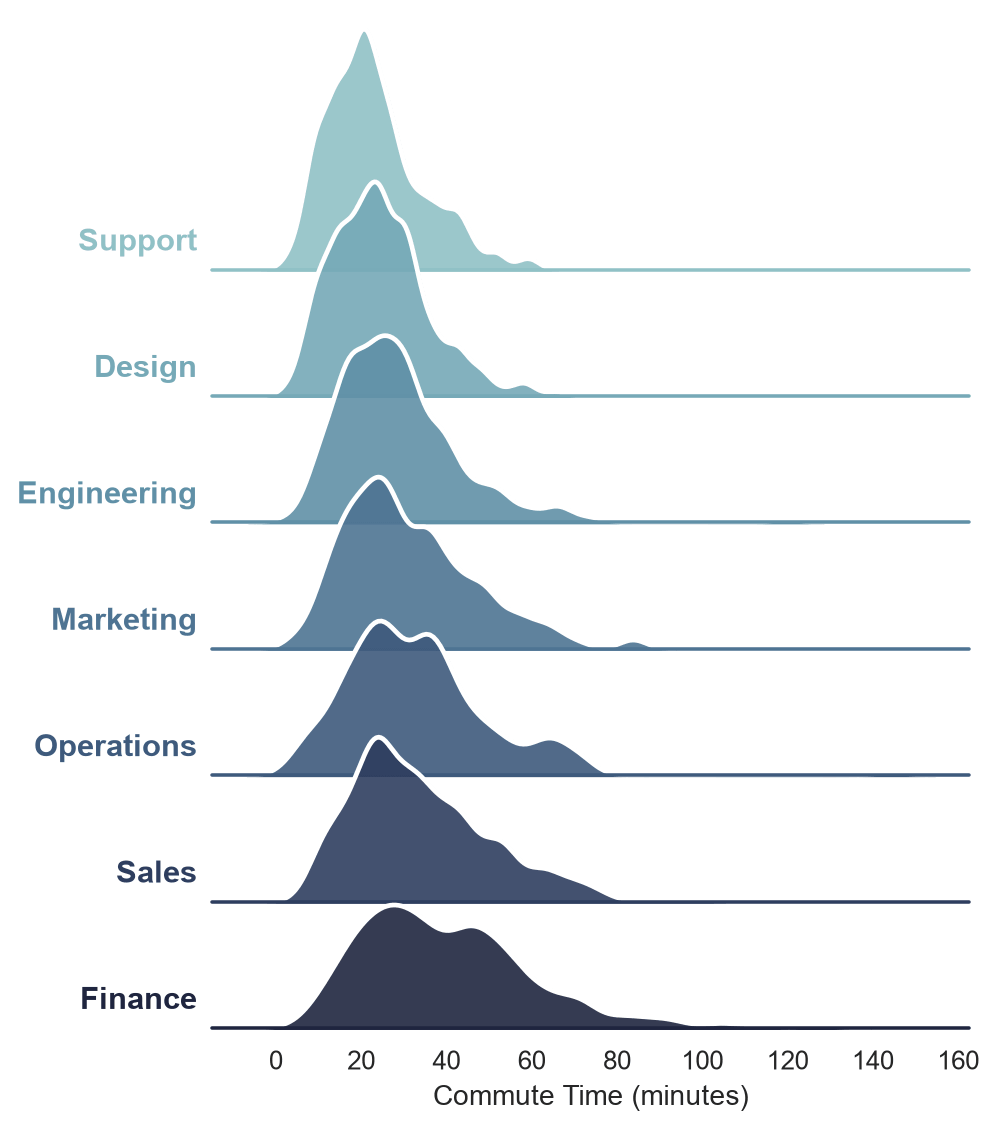
How to Create a Ridge Plot (Joyplot) in Python with Seaborn
Build a ridge plot (joyplot) in Seaborn using a FacetGrid of overlapping KDE curves.
Build a ridge plot (joyplot) in Seaborn using a FacetGrid of overlapping KDE curves.
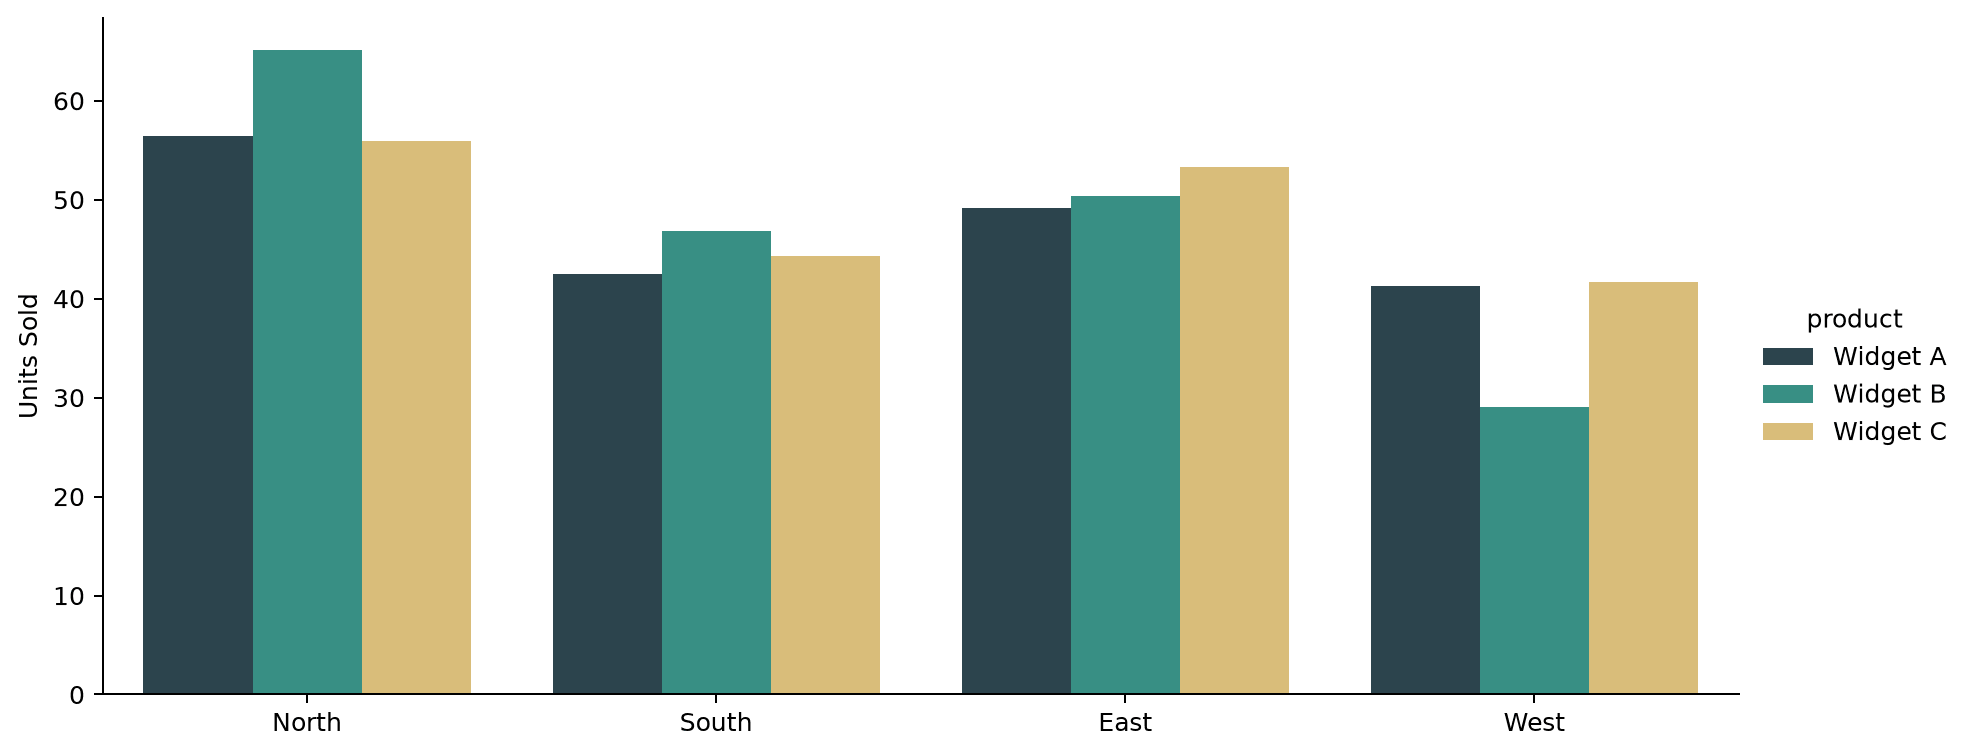
Control the size and shape of a Seaborn catplot using its height and aspect arguments instead of figsize.
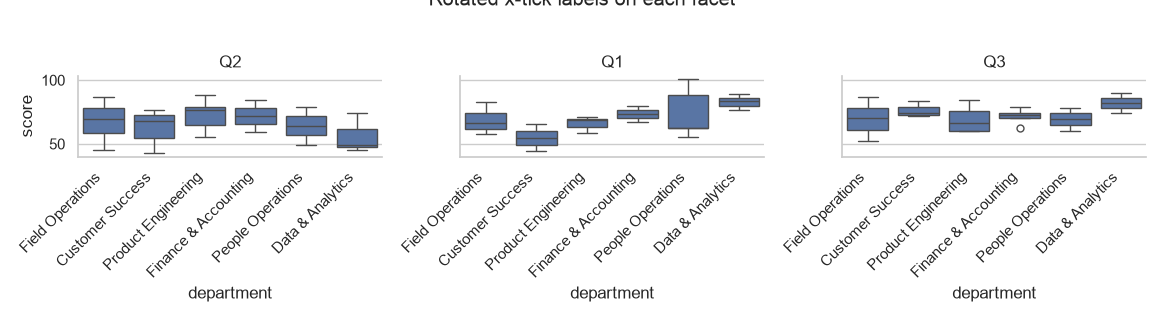
Rotate tick labels on Seaborn FacetGrid and pairplot figures with set_xticklabels and a small loop.