
catplot() is a figure-level function, and figure-level functions size themselves differently than the ax.bar()-style plots you build with plt.subplots(). There is no figsize argument. Instead, height and aspect control the size and shape of each facet, and this post covers what each one does and how they interact once you add faceting.
Quick Example
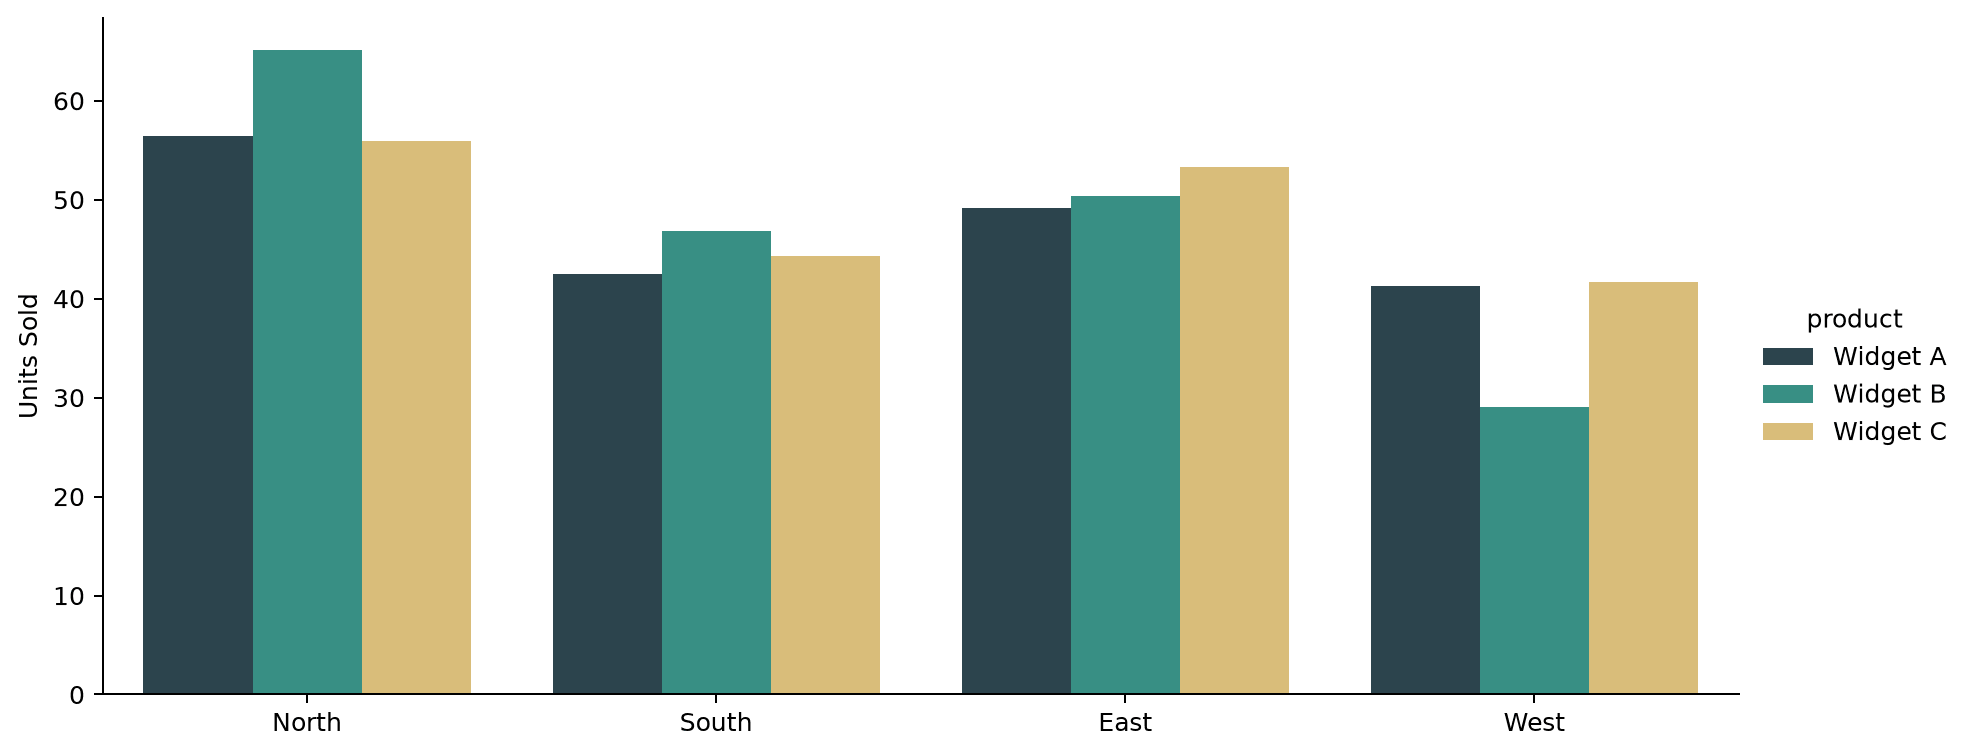
height sets each facet's height in inches; aspect multiplies that height to get the width. aspect=2 makes a facet twice as wide as it is tall.
import seaborn as sns

g = sns.catplot(
    data=df, x="region", y="units_sold", hue="product",
    kind="bar", height=4.5, aspect=2.2,
)
Why catplot does not take figsize
Axes-level functions like sns.barplot() or sns.lineplot() draw onto a matplotlib Axes you create yourself with plt.subplots(figsize=(9, 5)), so the normal matplotlib sizing applies. Figure-level functions like catplot(), relplot(), and lmplot() build their own FacetGrid, which can contain one facet or many, so a single figsize would not make sense once the plot facets into a grid of subplots. height and aspect describe one facet, and the grid's overall size comes from multiplying that by the number of rows and columns.
g = sns.catplot(data=df, x="region", y="units_sold", hue="product", kind="bar")
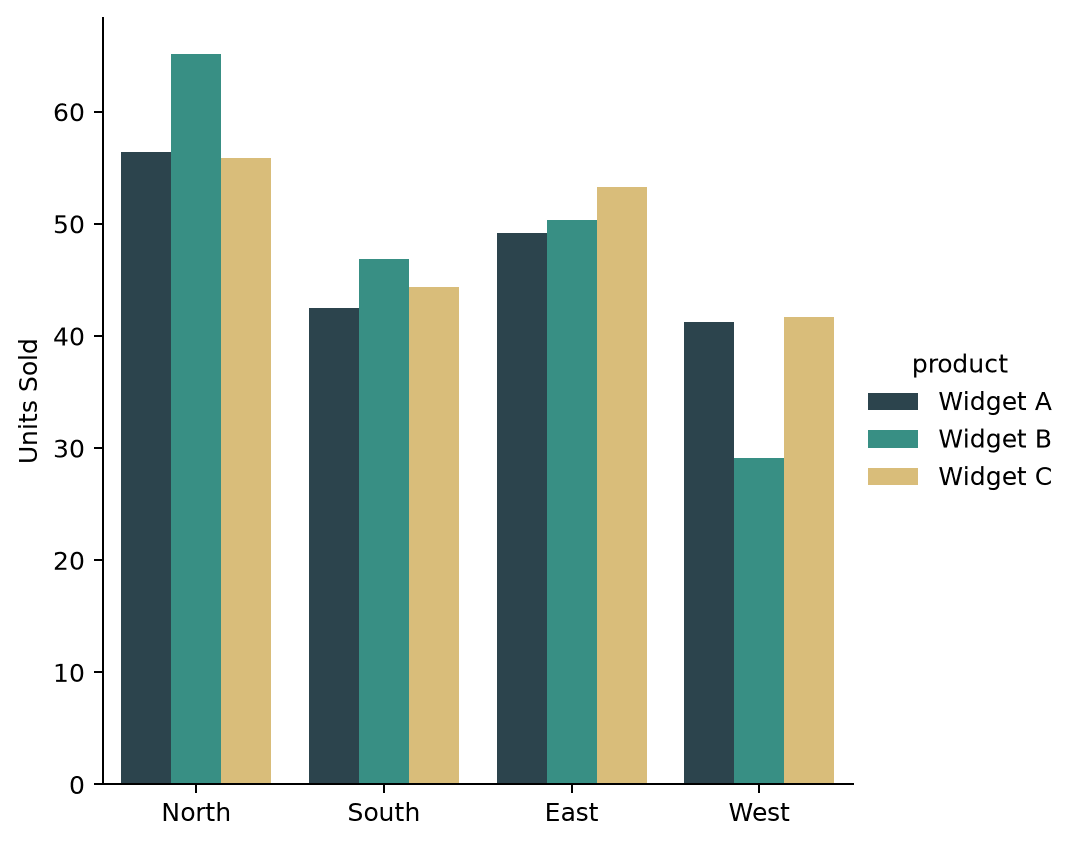
Left at the defaults (height=5, aspect=1), a single-facet catplot comes out close to a square, which is rarely the best shape for a bar chart with several categories along the x-axis.
Widen the plot with aspect
aspect is a ratio, width divided by height, so increasing it stretches the plot horizontally without changing how tall it is. This is the argument to reach for when category labels are crowding each other or bars feel squeezed together.
g = sns.catplot(
    data=df, x="region", y="units_sold", hue="product",
    kind="bar", height=4.5, aspect=2.2,
)
Going from the square default to aspect=2.2 at a slightly shorter height=4.5 gives each bar group noticeably more breathing room along the x-axis, and the legend has more room to sit beside the plot instead of crowding the bars.
Increase height for a taller plot
height is the more direct lever when a plot needs more vertical space, for instance when a legend has many entries or labels need more room to stack.
g = sns.catplot(
    data=df, x="region", y="units_sold", hue="product",
    kind="bar", height=7, aspect=1.3,
)
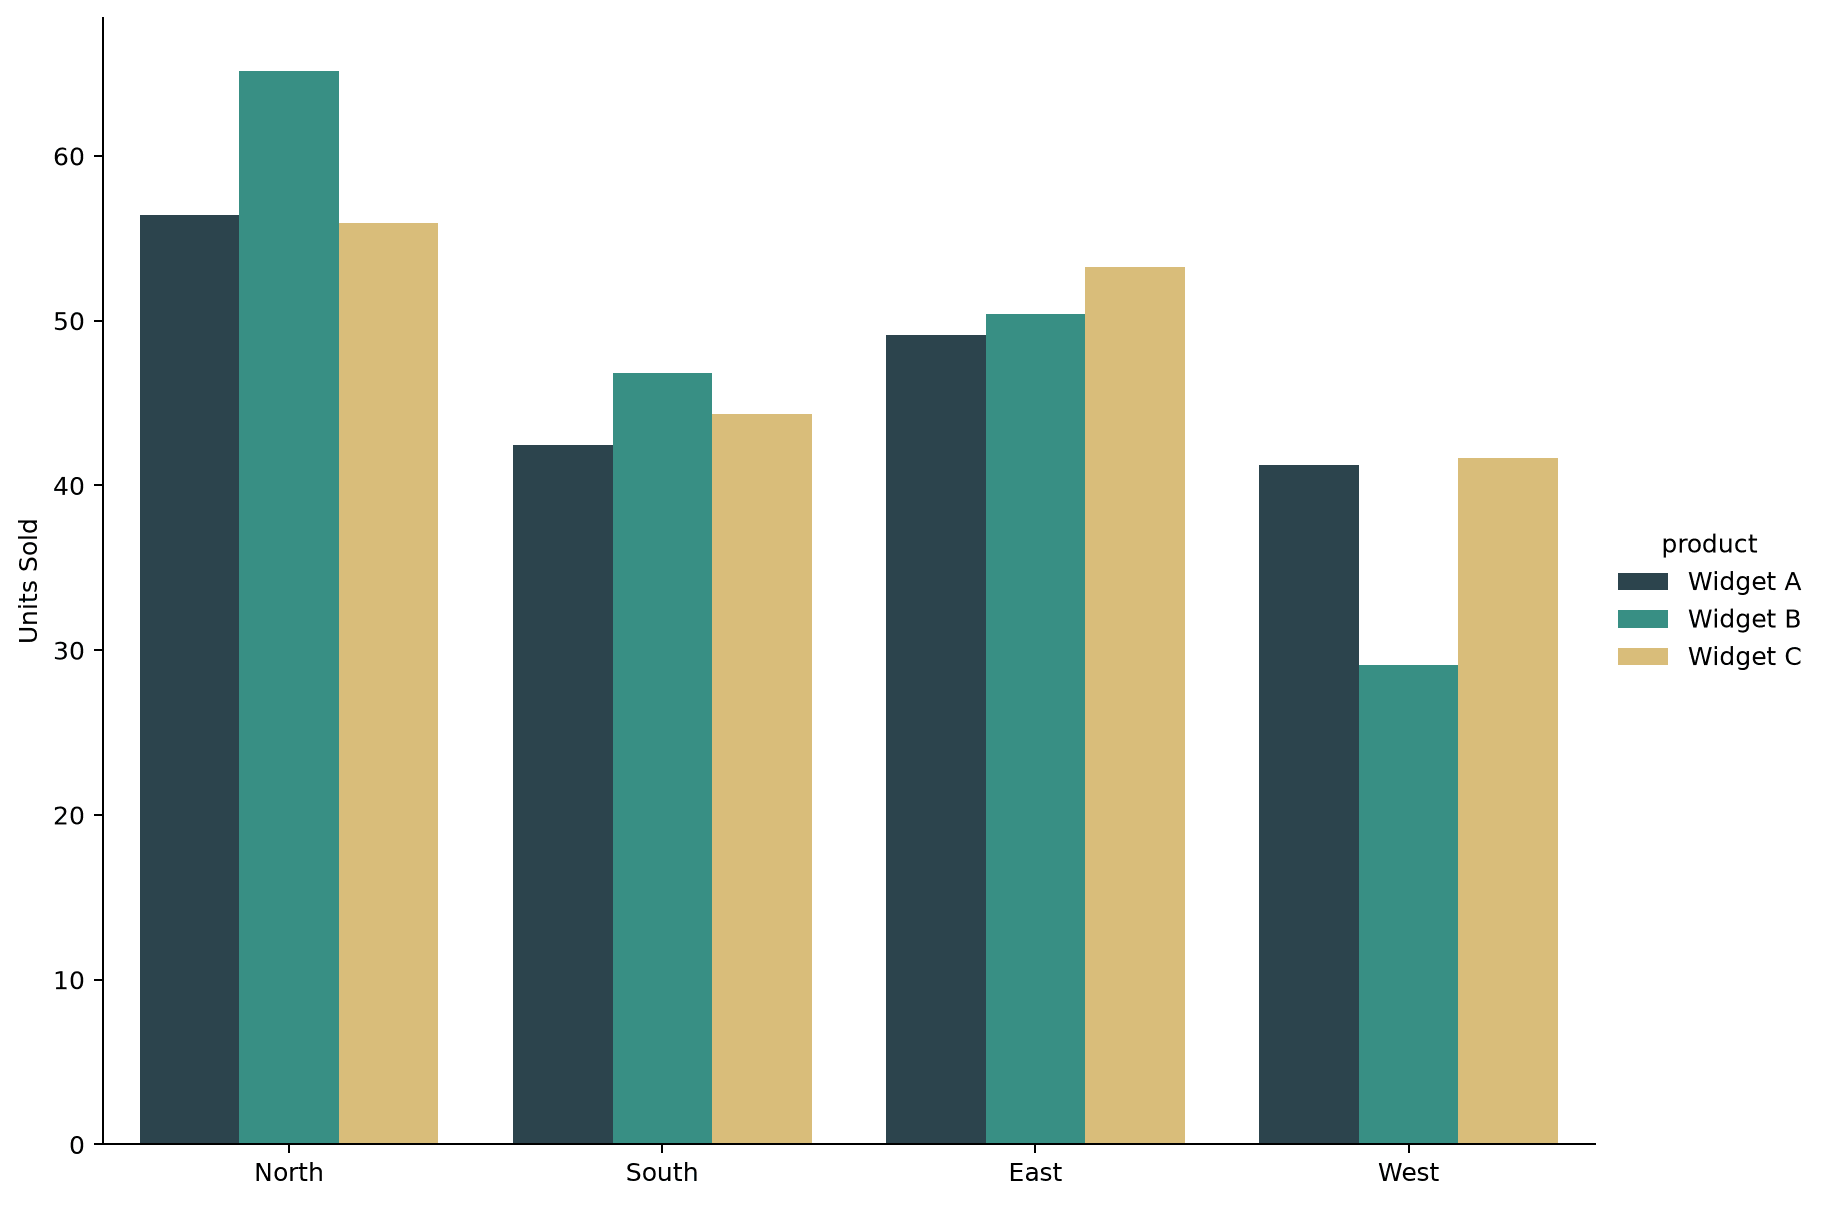
Raising height scales the whole facet up, width included (since aspect is a ratio, not a fixed width), so a taller plot at the same aspect also comes out wider. Adjust both together if you want to change only the vertical space.
How height and aspect scale with facets
Add a col or row argument and catplot builds one facet per category, each sized according to height and aspect. The overall figure width becomes roughly height * aspect * n_columns, so the same aspect that looked right for a single plot can make a faceted grid unreasonably wide.
g = sns.catplot(
    data=df, x="product", y="units_sold", hue="product",
    col="region", kind="box", height=3.2, aspect=0.8,
    col_wrap=4, legend=False,
)
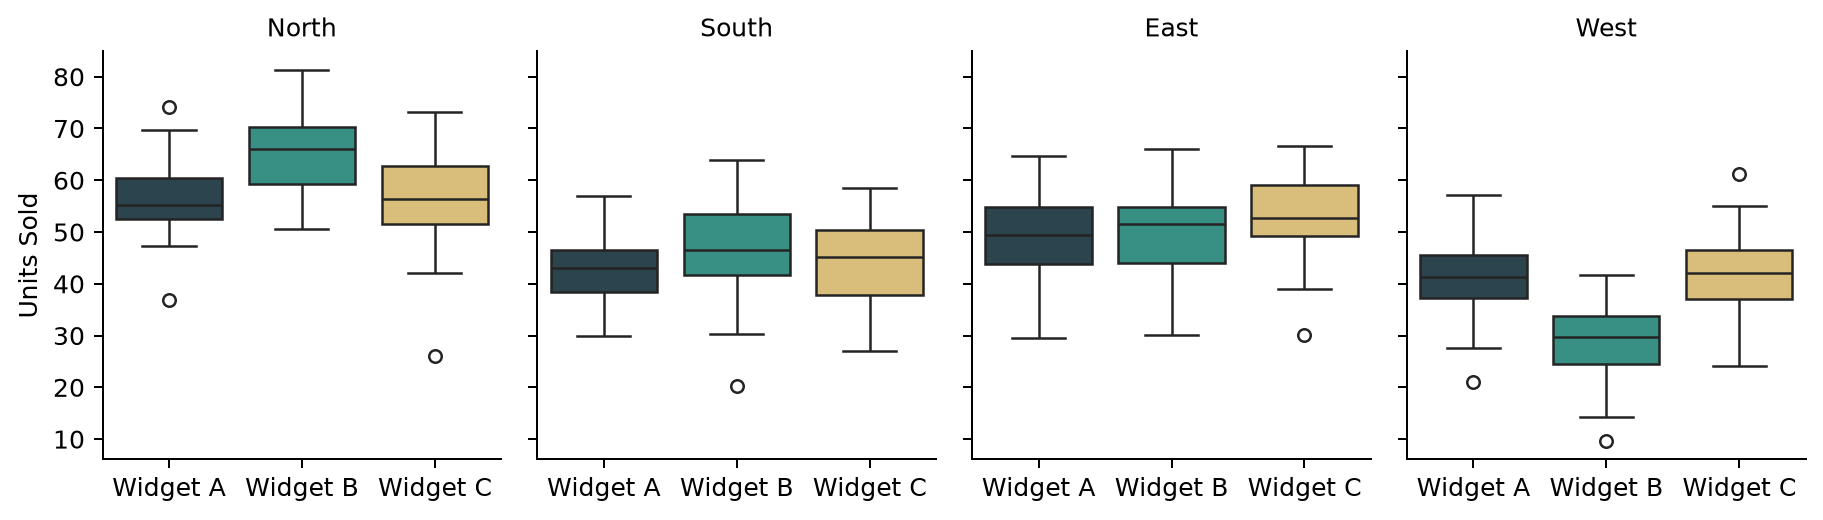
Each of the four region facets here is a small, slightly narrow box (aspect=0.8, narrower than tall) since there is less to show in each individual panel. For faceted plots, drop aspect closer to 1 or below and let col_wrap control how many facets sit in a row, rather than trying to keep the wide aspect that works for a single-panel chart.
Practical Tips
- Use
aspectto change the shape of a facet (wider or narrower) andheightto change its overall scale (bigger or smaller). - A single-facet
catplotusually looks better withaspectabove 1; theheight=5, aspect=1default skews square. - When faceting with
colorrow, bringaspectdown toward 1 (or below) since the total figure width multiplies by the number of columns. col_wraplimits how many facets sit in a row before wrapping to a new one, which keeps a faceted grid from stretching too wide regardless ofaspect.catplot()(and other figure-level functions) return aFacetGrid, so save it to a variable (g = sns.catplot(...)) to reachg.set(),g.set_titles(), org.figure.savefig()afterward.