
A Seaborn plot lives on a matplotlib figure, so plt.show() is not the only way it leaves your script. Calling fig.savefig() instead controls the resolution, file format, and cropping of the exported image, which matters as soon as a chart needs to go into a slide deck, a printed report, or a retina-screen blog post.
Quick Example
Build the plot as usual, then call savefig() on the figure with a dpi high enough for print or retina displays.
import matplotlib.pyplot as plt
import seaborn as sns

fig, ax = plt.subplots(figsize=(9, 5))
sns.lineplot(data=df, x="month", y="signups", marker="o", ax=ax)
fig.savefig("signups.png", dpi=300, bbox_inches="tight")
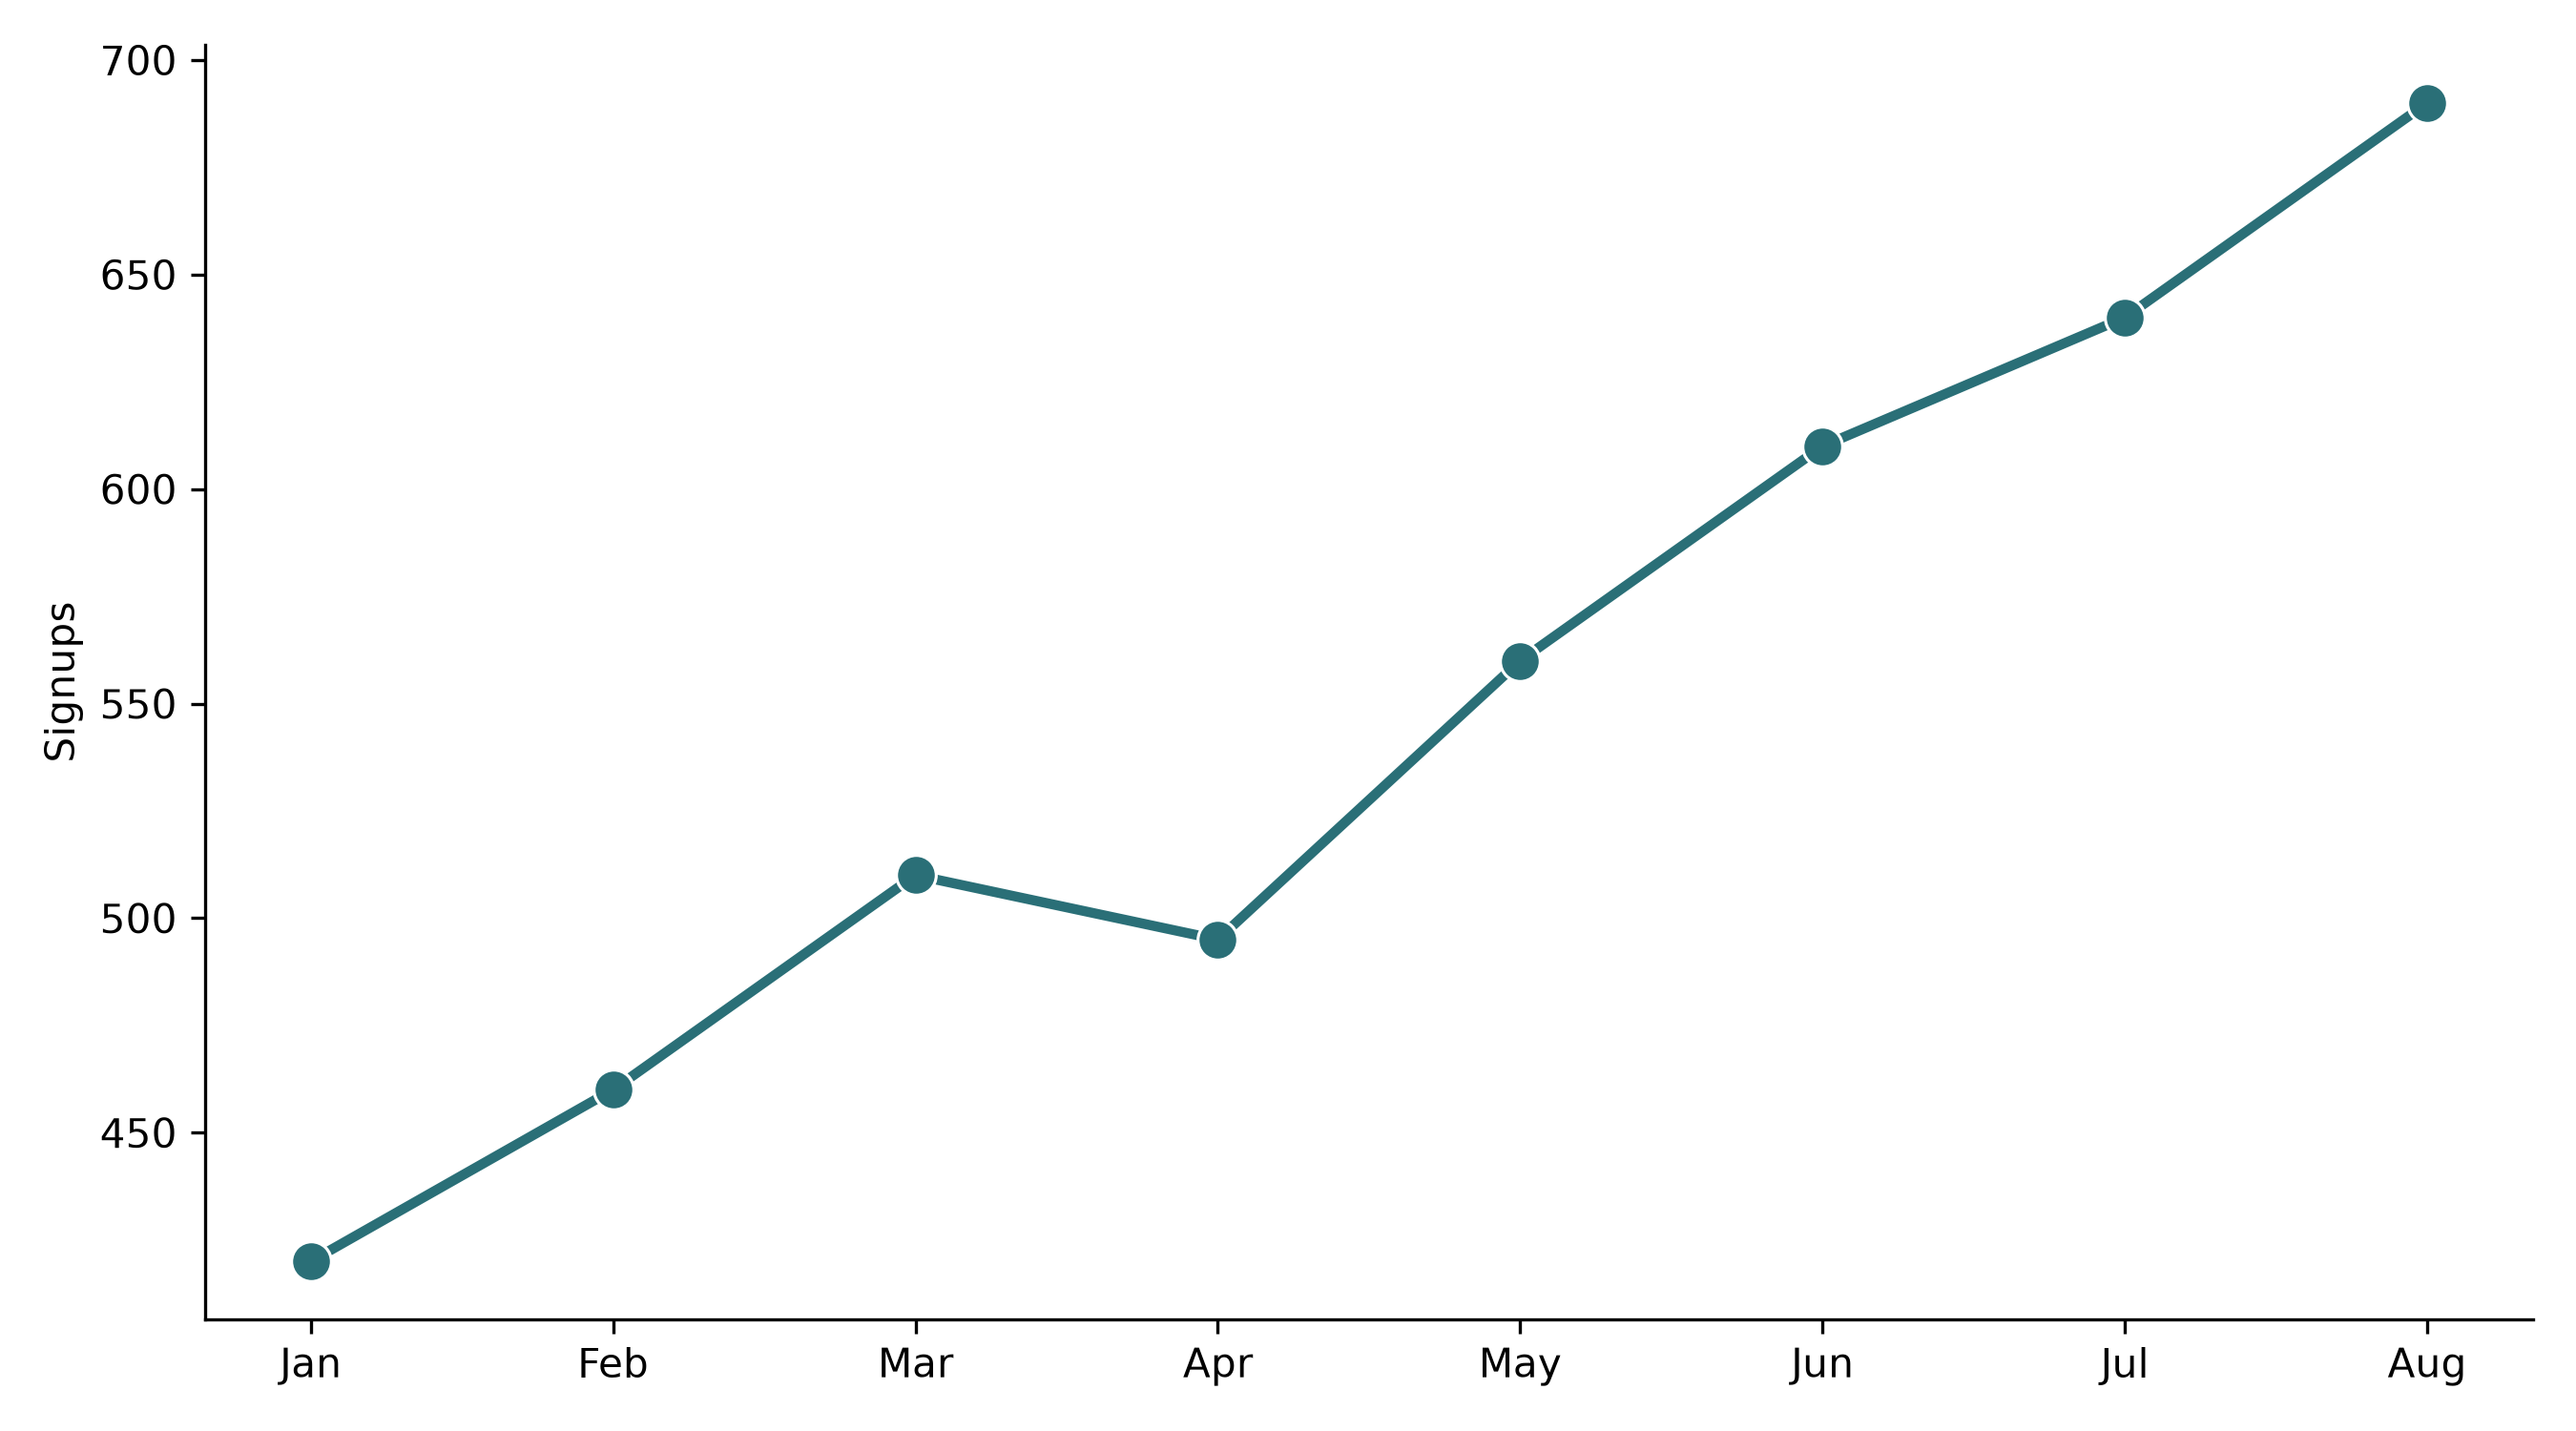
dpi=300 and bbox_inches="tight" cover most cases: a sharp image with the excess whitespace trimmed off the edges.
Why dpi matters
dpi (dots per inch) sets how many pixels get packed into each inch of the figure. fig.set_size_inches() or figsize fixes the physical size in inches, and dpi decides how much detail fills that size. The default matplotlib dpi is 100, which looks fine on a laptop screen but turns visibly blocky once printed or viewed on a high-density display.
fig.savefig("chart-72.png", dpi=72)
fig.savefig("chart-300.png", dpi=300)
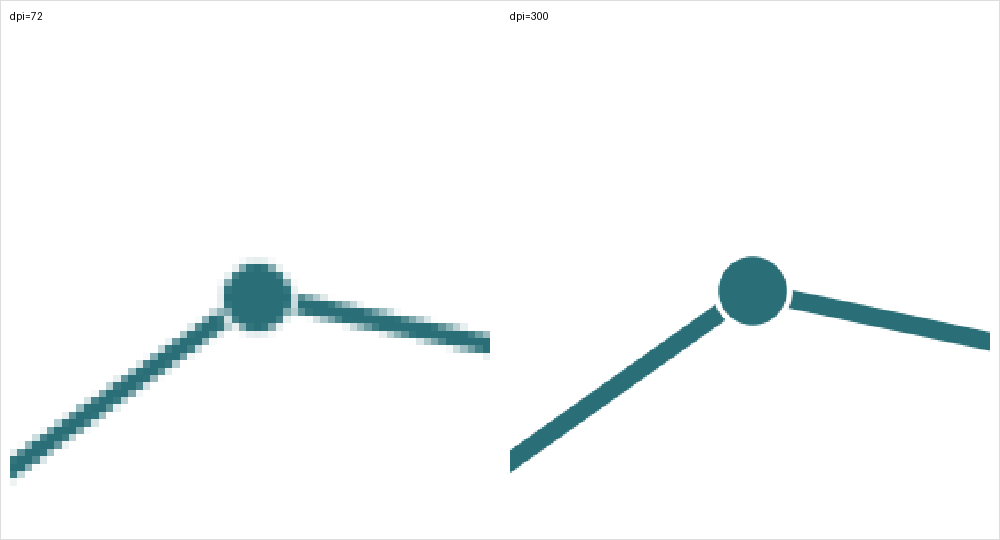
Cropped in on the same marker, the 72 dpi version breaks into visible stair-stepped pixels while the 300 dpi version stays smooth. 150 dpi is a reasonable floor for on-screen use; 300 dpi is the standard target for print and for images that need to hold up when someone zooms in.
Trim whitespace with bbox_inches
By default, matplotlib reserves a fixed margin around the axes so labels and titles do not get clipped, which often leaves more blank border than you want in a saved file. bbox_inches="tight" recalculates that box based on what is actually drawn, including legends placed outside the axes.
sns.move_legend(ax, "upper left", bbox_to_anchor=(1.02, 1), title="Smoker")
fig.savefig("boxplot.png", dpi=200, bbox_inches="tight")
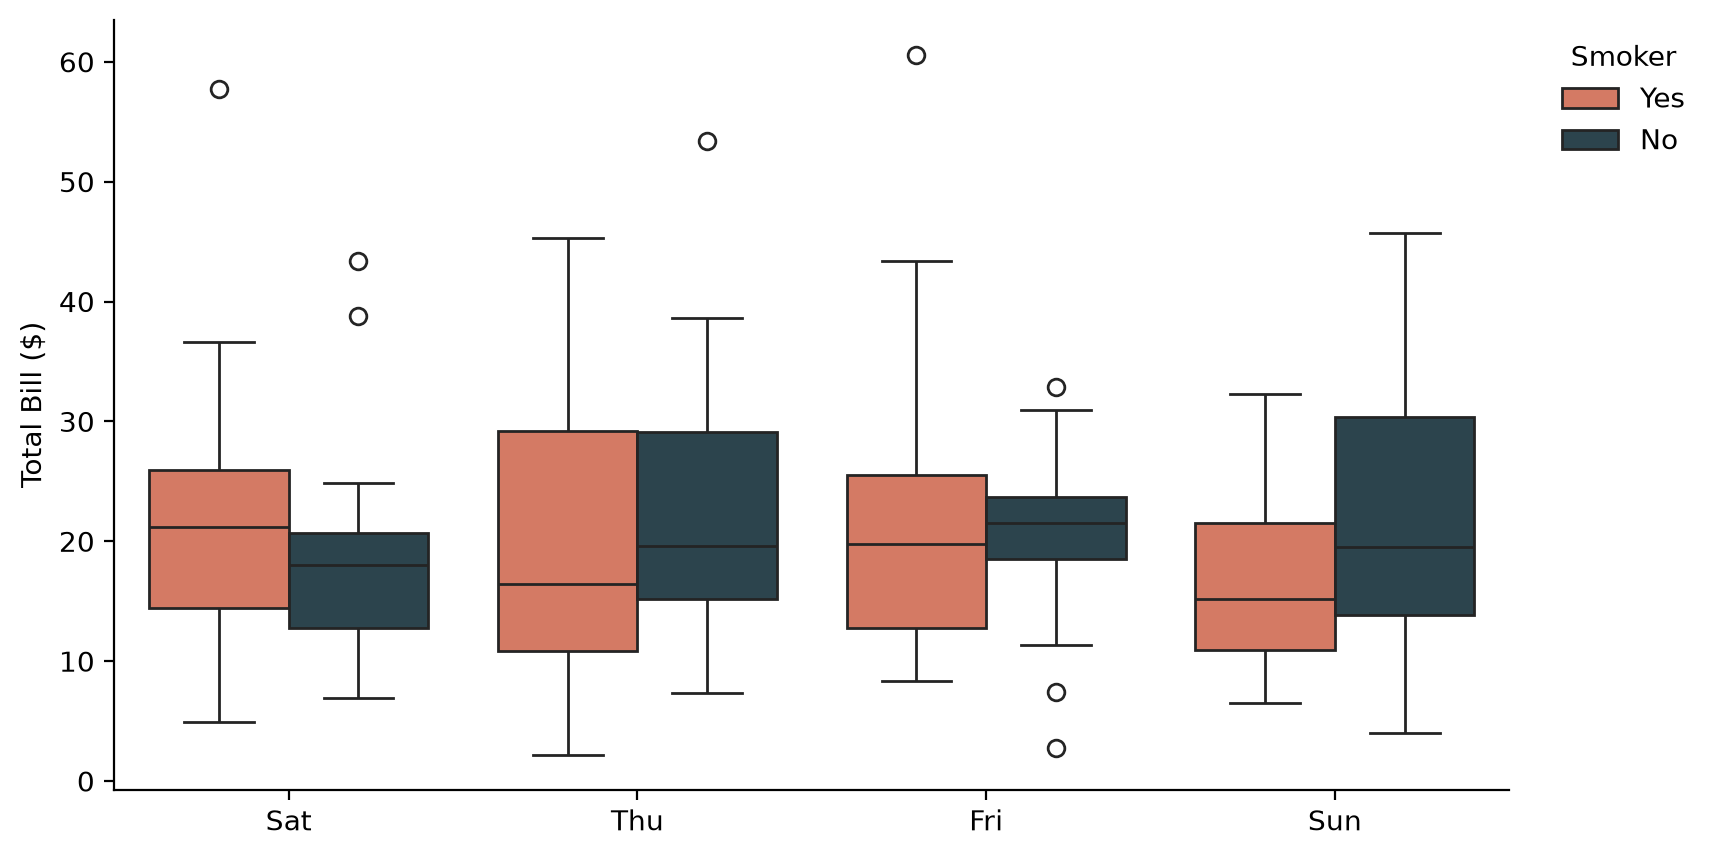
Without bbox_inches="tight", a legend placed outside the axes like this one gets cut off at the edge of the saved image instead of expanding the canvas to include it. pad_inches adds a small amount of padding back in if "tight" crops things a little too closely.
Vector formats for infinite scaling
PNG is a raster format, so dpi is a real tradeoff between file size and sharpness. SVG and PDF are vector formats: they store the actual shapes, so the output scales to any size with no pixelation and no dpi setting to worry about.
fig.savefig("chart.svg")
fig.savefig("chart.pdf")
Reach for SVG or PDF when the chart is going into a document or presentation that someone else will resize, or into anything printed at a size you cannot predict ahead of time. Stick with PNG (at a high dpi) for the web, since SVGs with a lot of data points can render slowly and most blogging platforms expect raster images anyway.
Saving figure-level plots
Functions like sns.relplot(), sns.catplot(), and sns.lmplot() return a FacetGrid, not a figure directly. The figure is available at .figure (or the older .fig alias), and that is what savefig() gets called on.
g = sns.relplot(data=df, x="total_bill", y="tip", hue="time",
                 height=5, aspect=1.5)
g.figure.savefig("relplot.png", dpi=250, bbox_inches="tight")
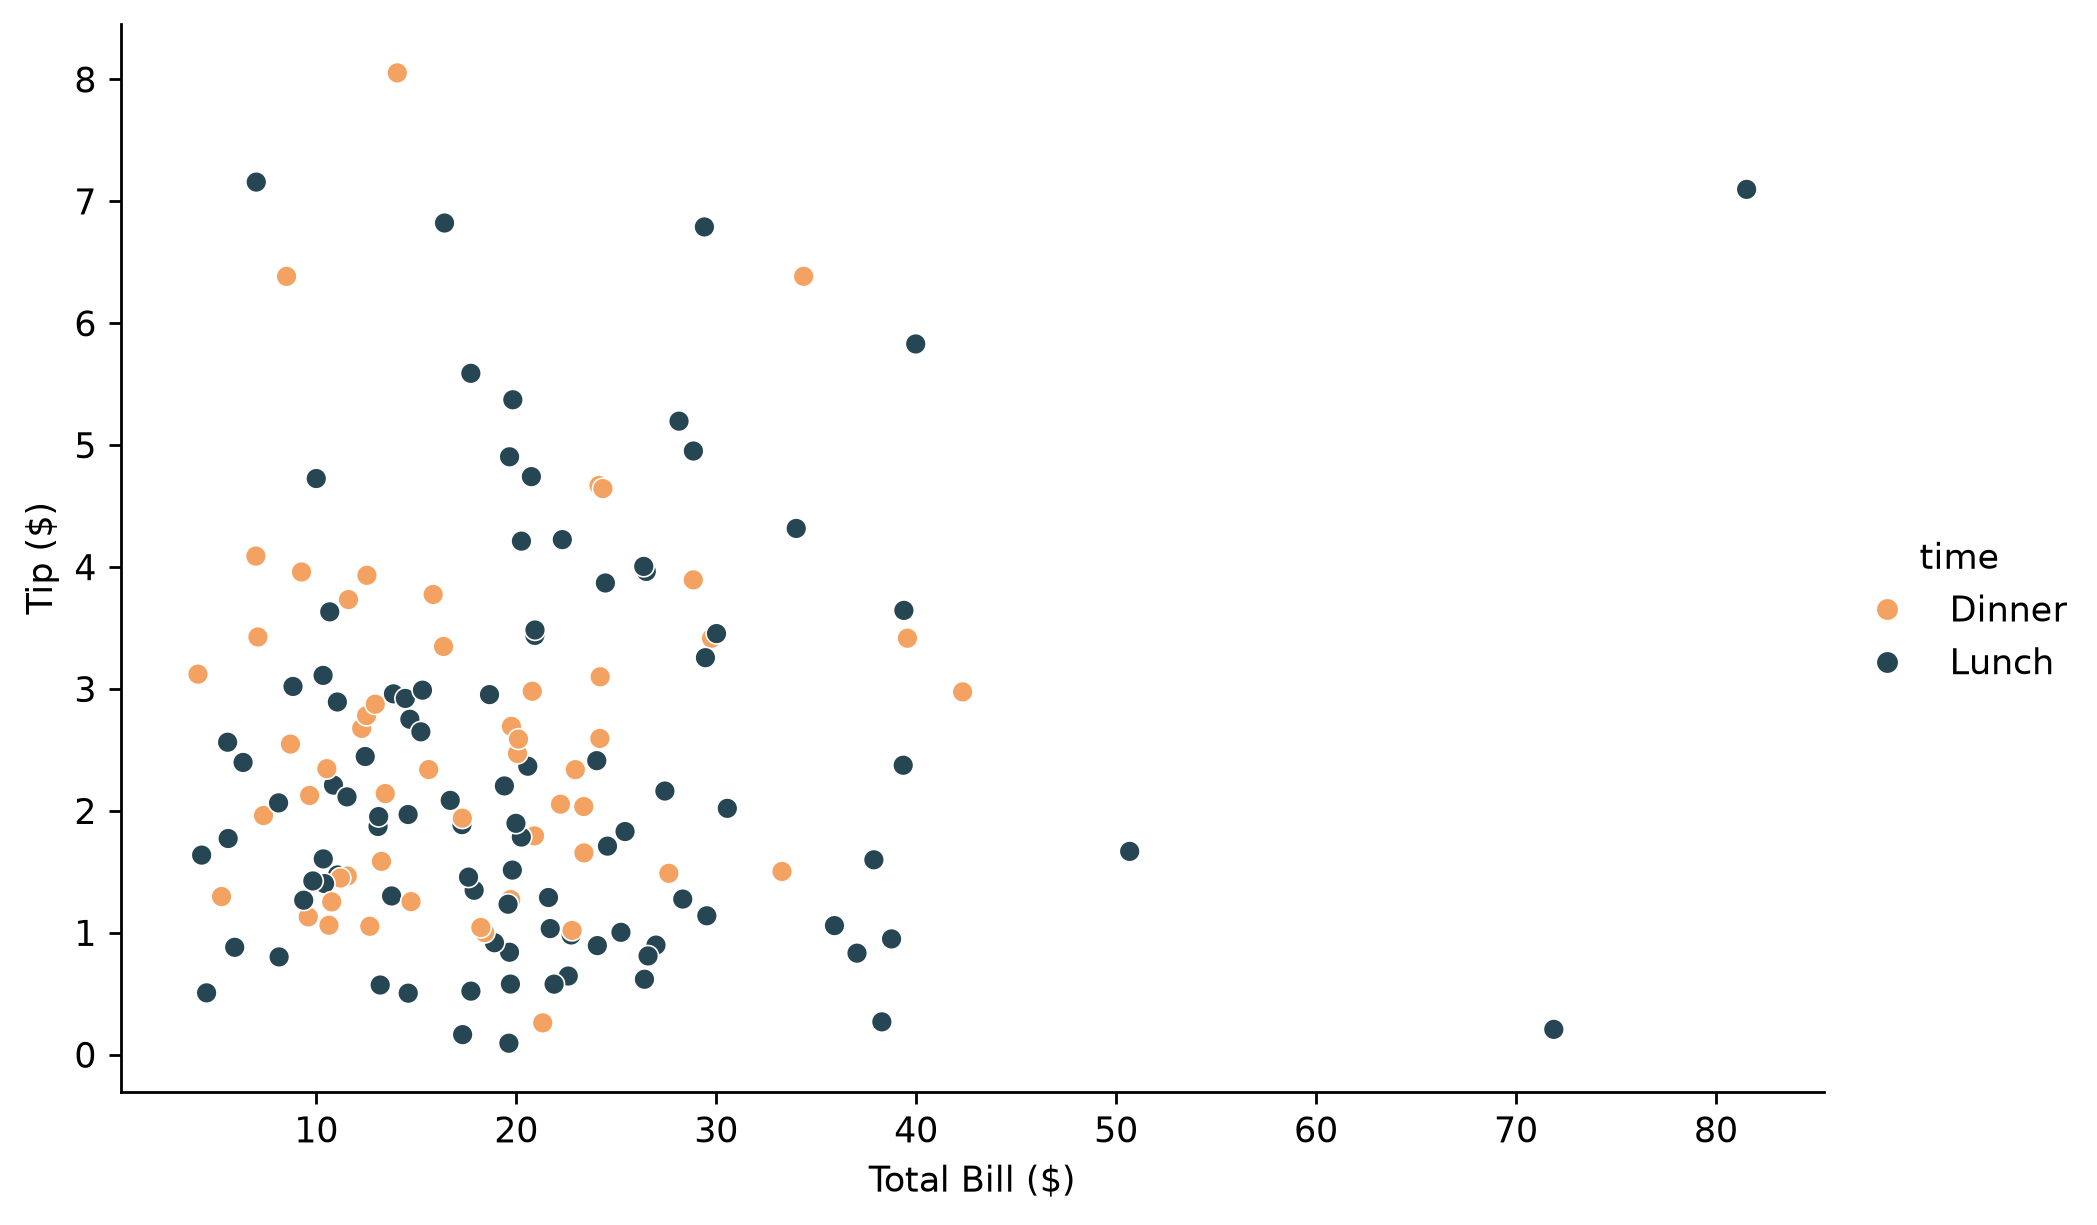
Calling g.savefig() directly also works since FacetGrid forwards it to the underlying figure, but g.figure.savefig() makes clear you are working with a matplotlib figure, which is the same object plt.subplots() returns for axes-level functions like barplot() or lineplot().
Practical Tips
- Use
dpi=300for print or retina-quality PNGs;dpi=150is usually enough for a standard web image. - Add
bbox_inches="tight"by default; it trims wasted margin and rescues legends or labels placed outside the axes. - Set
figsizedeliberately before plotting rather than resizing after, since font and marker sizes are relative to the figure's inch dimensions, not its pixel count. - Prefer SVG or PDF for anything that will be resized or printed at an unknown size, since vector formats have no
dpiceiling. - For figure-level plots (
relplot,catplot,lmplot,pairplot), callsavefig()ong.figure, not on theFacetGridvariable'sax(it does not have one).