
TL;DR
Use ax.tick_params() to quickly change tick label size and color. For deeper font styling (like bold, italic, or custom font families), loop through the tick labels using ax.get_xticklabels() or ax.get_yticklabels() and call the font setter methods.
import matplotlib.pyplot as plt

fig, ax = plt.subplots(figsize=(6, 4))
ax.plot([1, 2, 3], [10, 20, 15])

# 1. Quick size and color configuration
ax.tick_params(axis='y', labelsize=12, labelcolor='#e65100')

# 2. Detailed font customization (family, weight, style)
for label in ax.get_xticklabels():
    label.set_fontsize(14)
    label.set_fontweight('bold')
    label.set_fontstyle('italic')
    label.set_fontfamily('serif')
    label.set_color('#2e7d32')

plt.show()
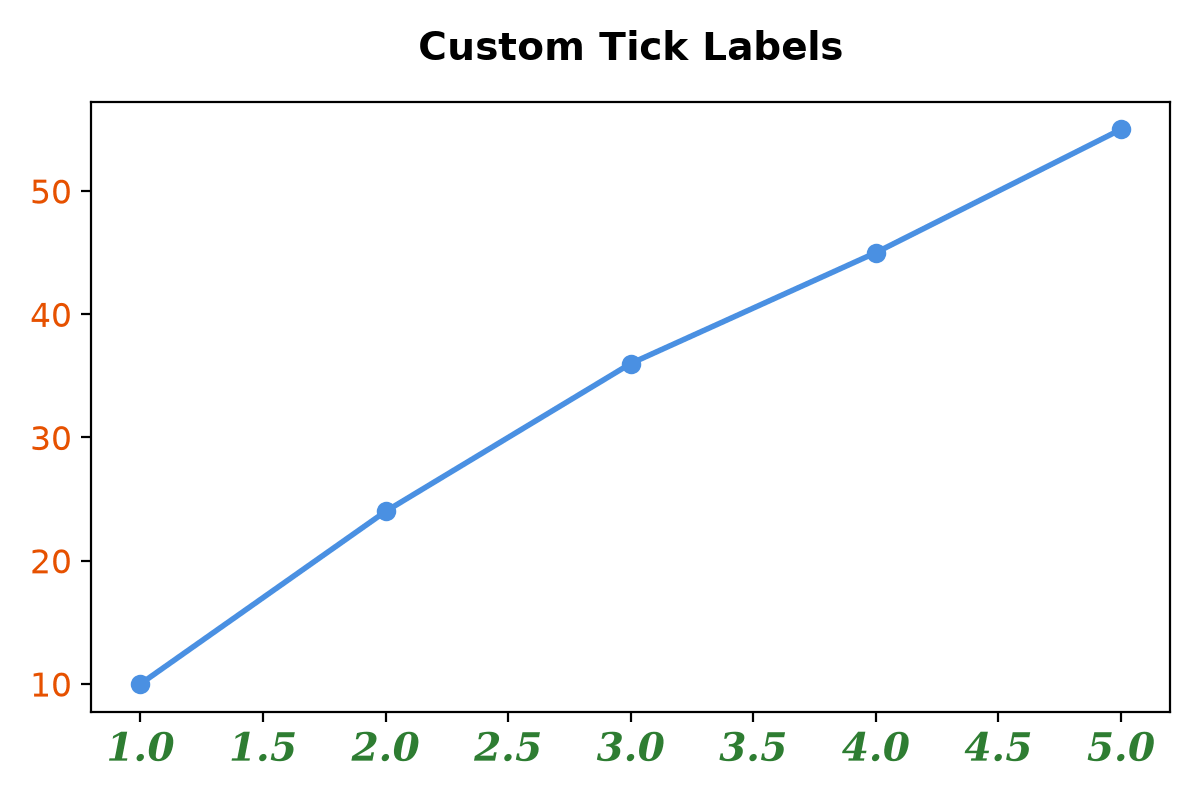
Quick Customization with tick_params
If you only need to change the font size or color of the tick labels, the easiest method is ax.tick_params(). This method is highly optimized and handles all ticks on an axis at once.
You can specify which axis to target ('x', 'y', or 'both'):
# Change both x and y tick label size to 14
ax.tick_params(axis='both', labelsize=14)

# Change only y-axis label size to 12 and color to red
ax.tick_params(axis='y', labelsize=12, labelcolor='red')
Detailed Styling with get_xticklabels
To change more advanced font properties—like font weight, family, or style—modify the underlying Text objects directly.
Matplotlib exposes these objects through ax.get_xticklabels() and ax.get_yticklabels(). Loop through them to apply customization:
# Customize x-axis tick labels
for label in ax.get_xticklabels():
    label.set_fontfamily('sans-serif')   # 'serif', 'sans-serif', 'monospace'
    label.set_fontweight('bold')         # 'normal', 'bold', 'light'
    label.set_fontstyle('italic')        # 'normal', 'italic', 'oblique'
    label.set_rotation(45)               # Rotate labels if they overlap

# Customize y-axis tick labels
for label in ax.get_yticklabels():
    label.set_fontsize(11)
    label.set_fontweight('light')
Global Customization with rcParams
To change the tick label font size for every single plot in your script or notebook, update Matplotlib's global runtime configuration (rcParams):
import matplotlib.pyplot as plt

# Apply globally to all future plots
plt.rcParams['xtick.labelsize'] = 12
plt.rcParams['ytick.labelsize'] = 12