
TL;DR
To remove both tick marks and tick labels, set the ticks to an empty list:
ax.set_xticks([])
ax.set_yticks([])
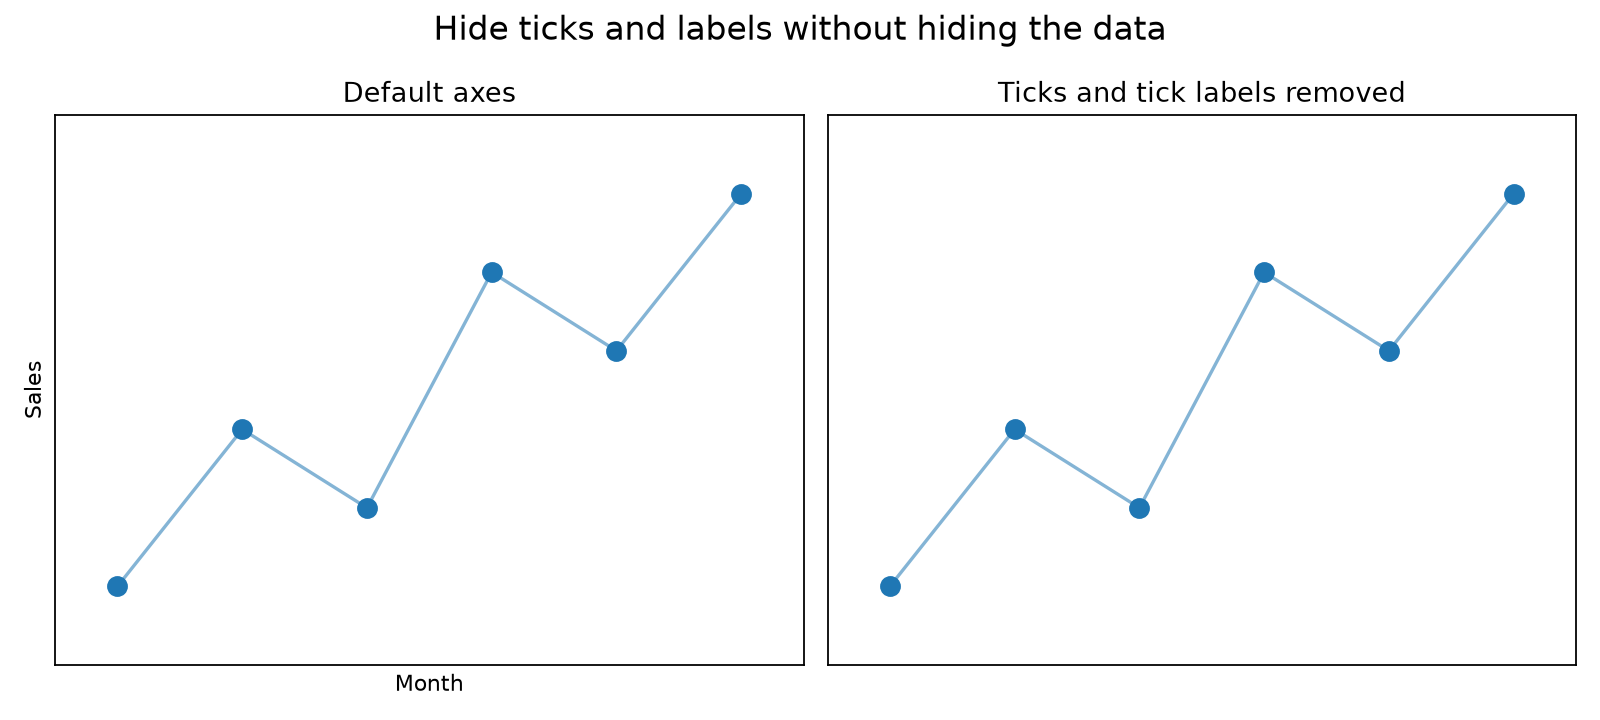
This keeps the plotted data and the axis spines visible.
Hide Only Tick Labels
Keep the tick marks but hide their numbers or text with tick_params():
ax.tick_params(axis="x", labelbottom=False)
ax.tick_params(axis="y", labelleft=False)
Use labeltop=True, labelright=True, or the corresponding False values when you need to control a particular side.
Hide Only Tick Marks
To retain the tick labels but remove the small tick marks:
ax.tick_params(bottom=False, left=False)
Remove the Axis Labels
The x-axis and y-axis labels are separate from tick labels. Clear them like this:
ax.set_xlabel("")
ax.set_ylabel("")
Hide Everything Around the Plot
For an image-like plot with no spines, ticks, tick labels, or axis labels:
ax.axis("off")