Adding a Legend in Matplotlib
In this post, we'll go through how to add and customize legends in Matplotlib.
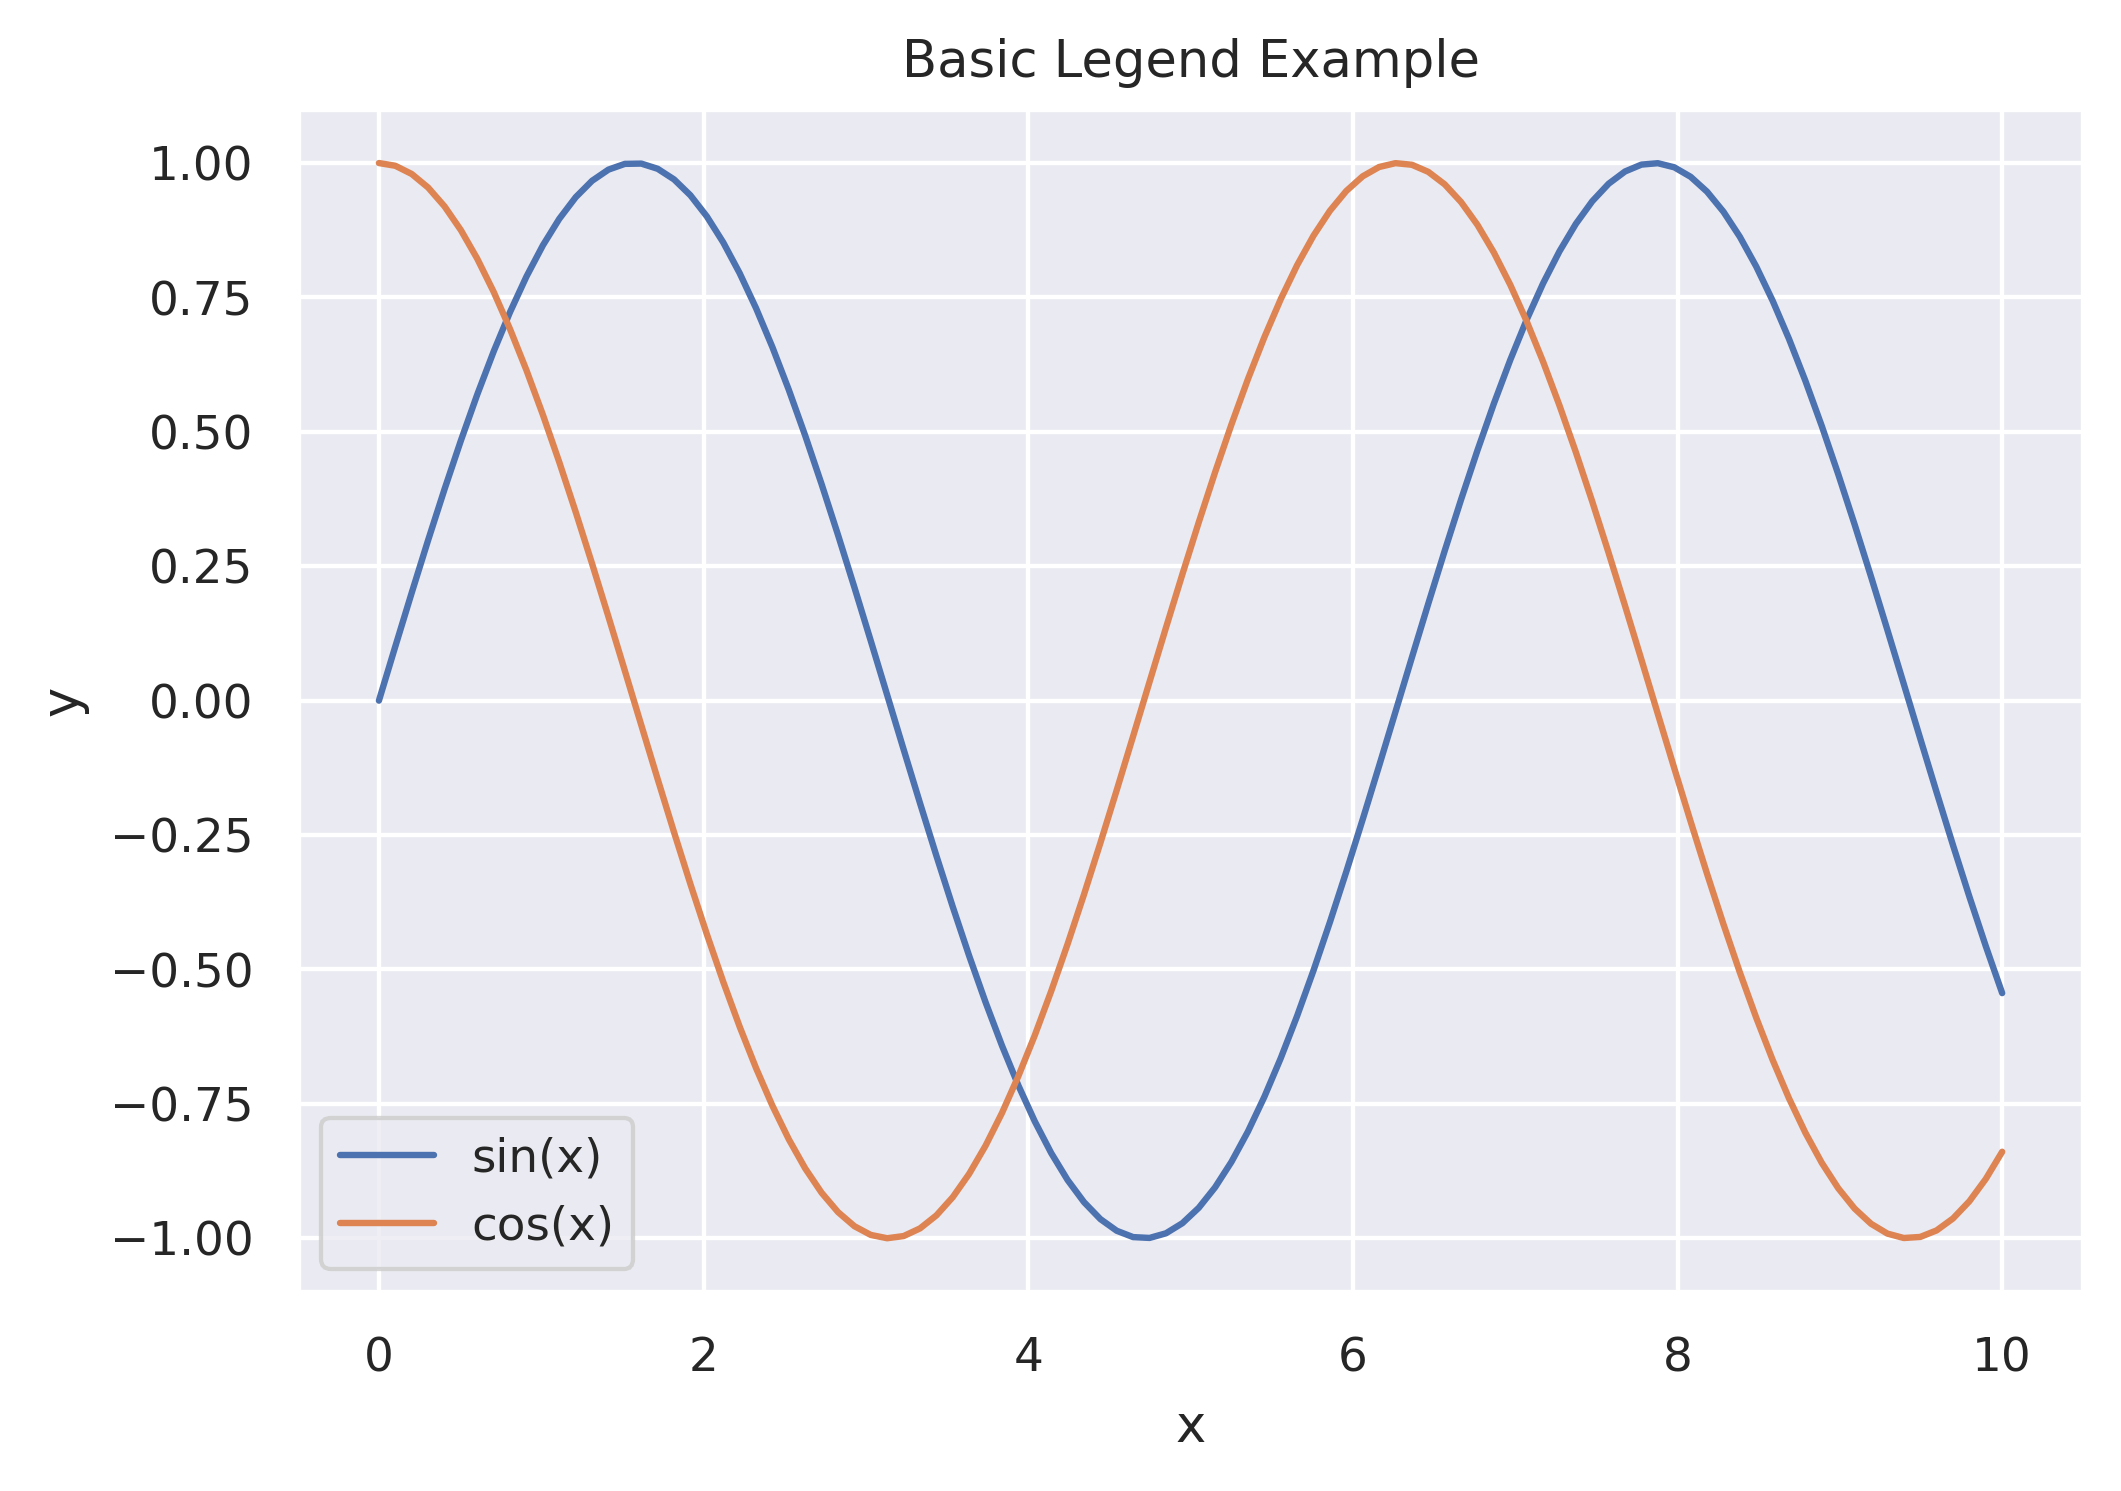
Adding a legend to an existing plot in Matplotlib is a simple command, but can have some gotchas. If using plt, you
can simply add plt.legend(), as seen below, to add a legend to the existing figure. When using the object-oriented
approach, this would look very similar, but you'd just be calling legend() on the axes object, like ax.legend().
The important thing to note is that in the two plt.plot() calls below we add a label property. The value of this
is used in the legend and it's much easier to set at plot time versus trying to add later.
from matplotlib import pyplot as plt
from matplotlib_inline.backend_inline import set_matplotlib_formats
import numpy as np

plt.figure()
x = np.linspace(0, 10, 100)
plt.plot(x, np.sin(x), label='sin(x)')
plt.plot(x, np.cos(x), label='cos(x)')
plt.xlabel('x')
plt.ylabel('y')
plt.title('Basic Legend Example')
plt.legend()
plt.show()
Legend Location and Moving it Outside the Plot
While the default legend location inside the plotting area conserves space, it can also overlap with portions of the
plot, even if moved around. A nice solution to this is to place the legend outside the chart using bbox_to_anchor.
plt.figure()
plt.plot(x, np.sin(x), label='sin(x)')
plt.plot(x, np.cos(x), label='cos(x)')
plt.xlabel('x')
plt.ylabel('y')
plt.title('Legend Outside Plotting Area')
plt.legend(bbox_to_anchor=(1.05, 1), loc='upper left', borderaxespad=0.)
plt.show()

Legend Style and Customization
There are various ways you can customize the legend. In our first example, we'll give the legend a title, round the corners, and give it a drop shadow.
plt.figure()
plt.plot(x, np.sin(x), label='sin(x)', linestyle='--', color='red', linewidth=2)
plt.plot(x, np.cos(x), label='cos(x)', linestyle=':', color='blue', linewidth=3)
plt.xlabel('x')
plt.ylabel('y')
plt.title('Customized Legend Example')
plt.legend(title='Functions', fancybox=True, shadow=True, borderpad=1)
plt.show()

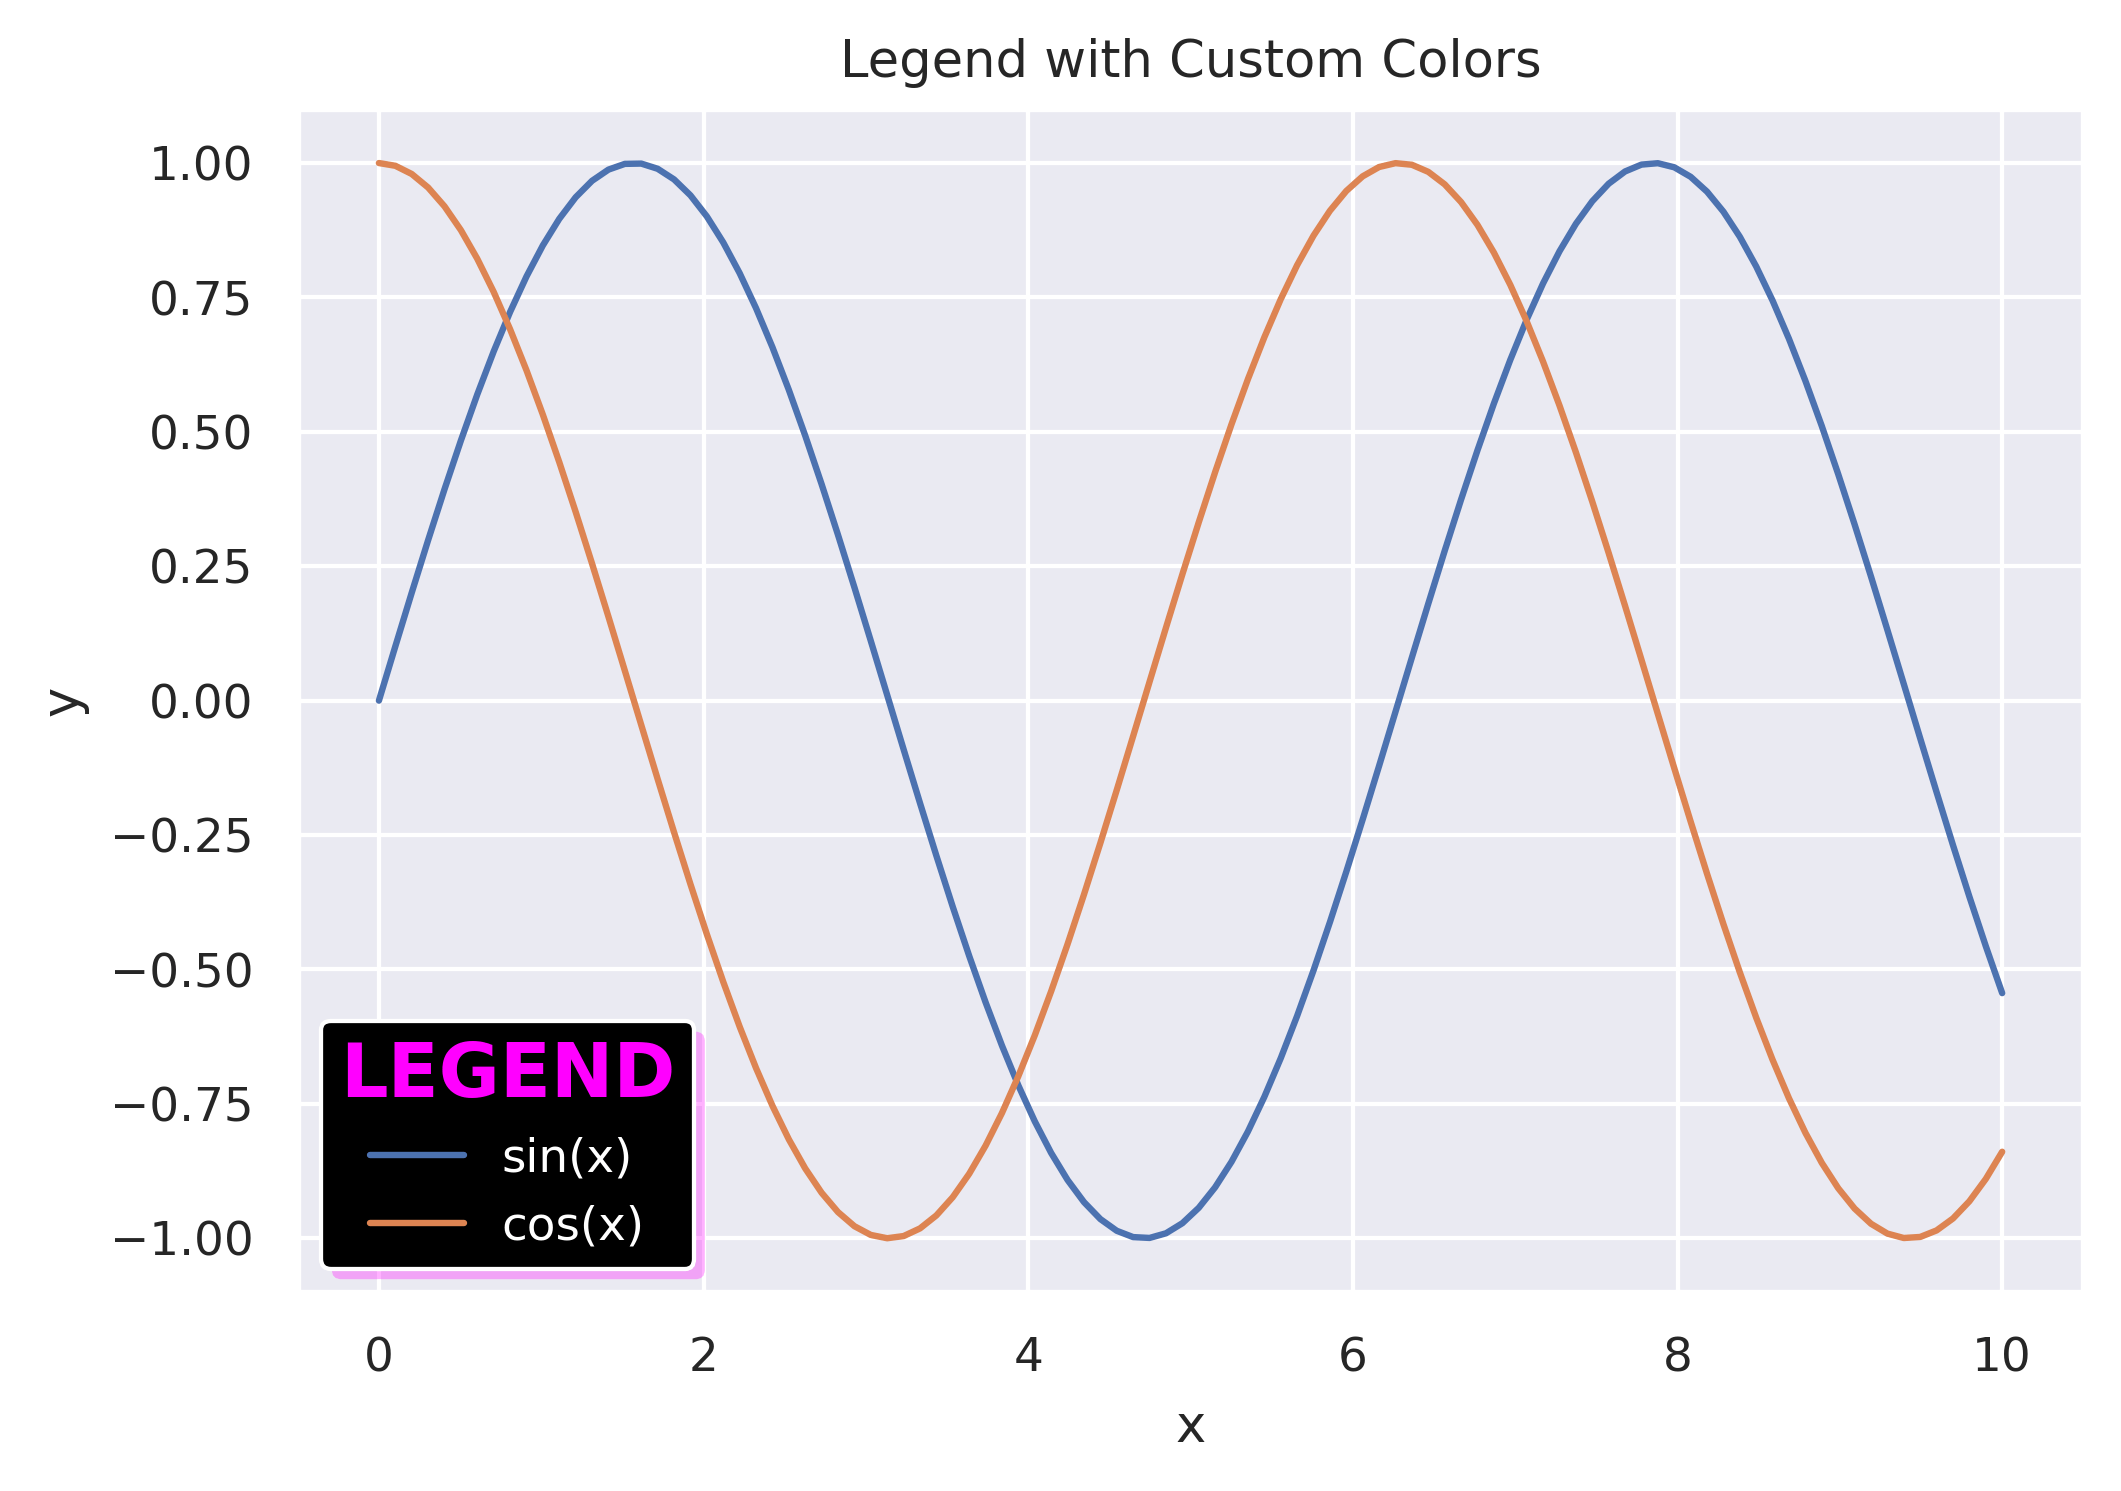
Lastly, we'll go a bit overboard, just to show a few more options for legend customization.
plt.figure()
plt.plot(x, np.sin(x), label='sin(x)')
plt.plot(x, np.cos(x), label='cos(x)')
plt.xlabel('x')
plt.ylabel('y')
plt.title('Legend with Custom Colors')
legend = plt.legend(
    title='LEGEND', facecolor='black', edgecolor='white', title_fontproperties={'size': 14, 'weight': 'bold'}, labelcolor='white', shadow={'color': 'magenta', 'alpha': 0.3, 'linewidth': 0}
)
# Set the color of the legend title.
legend.get_title().set_color('magenta')
plt.show()
So there you go, a nice custom legend, and the power to position it wherever you'd like. There is more great documentation in the Matplotlib official docs: