Matplotlib
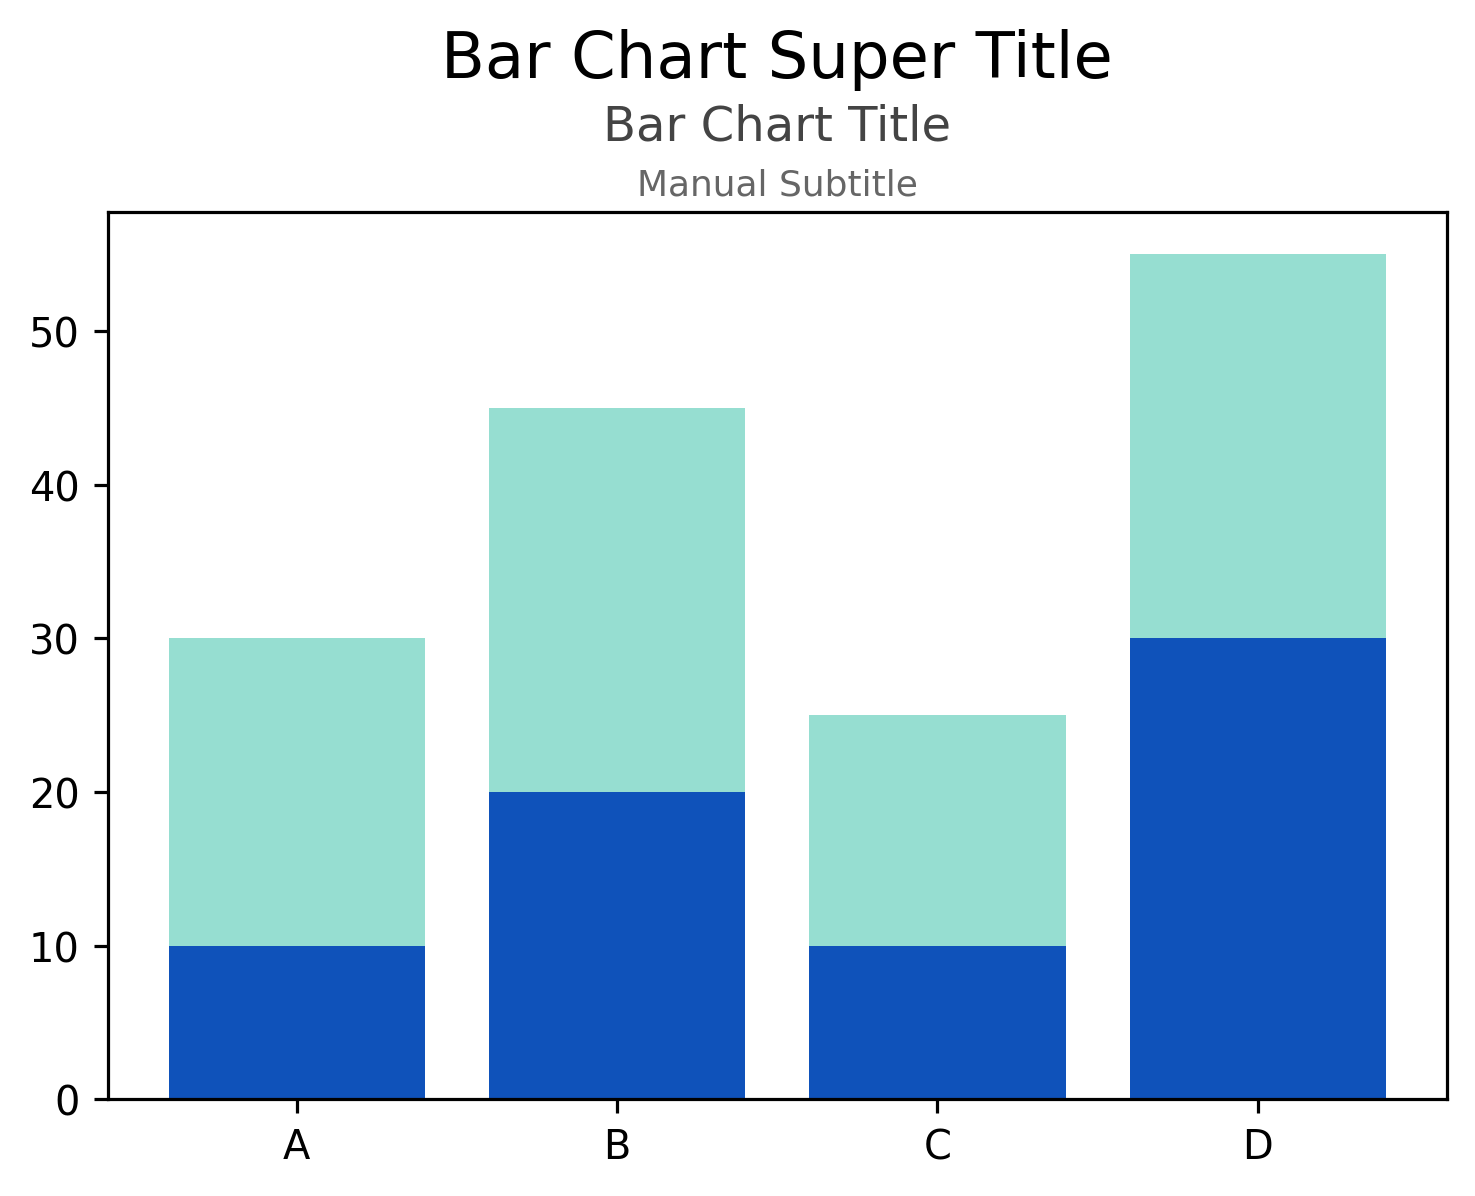
Setting and Customizing Titles and Subtitles in Matplotlib
Setting plot titles and subtitles in Matplotlib
Setting plot titles and subtitles in Matplotlib
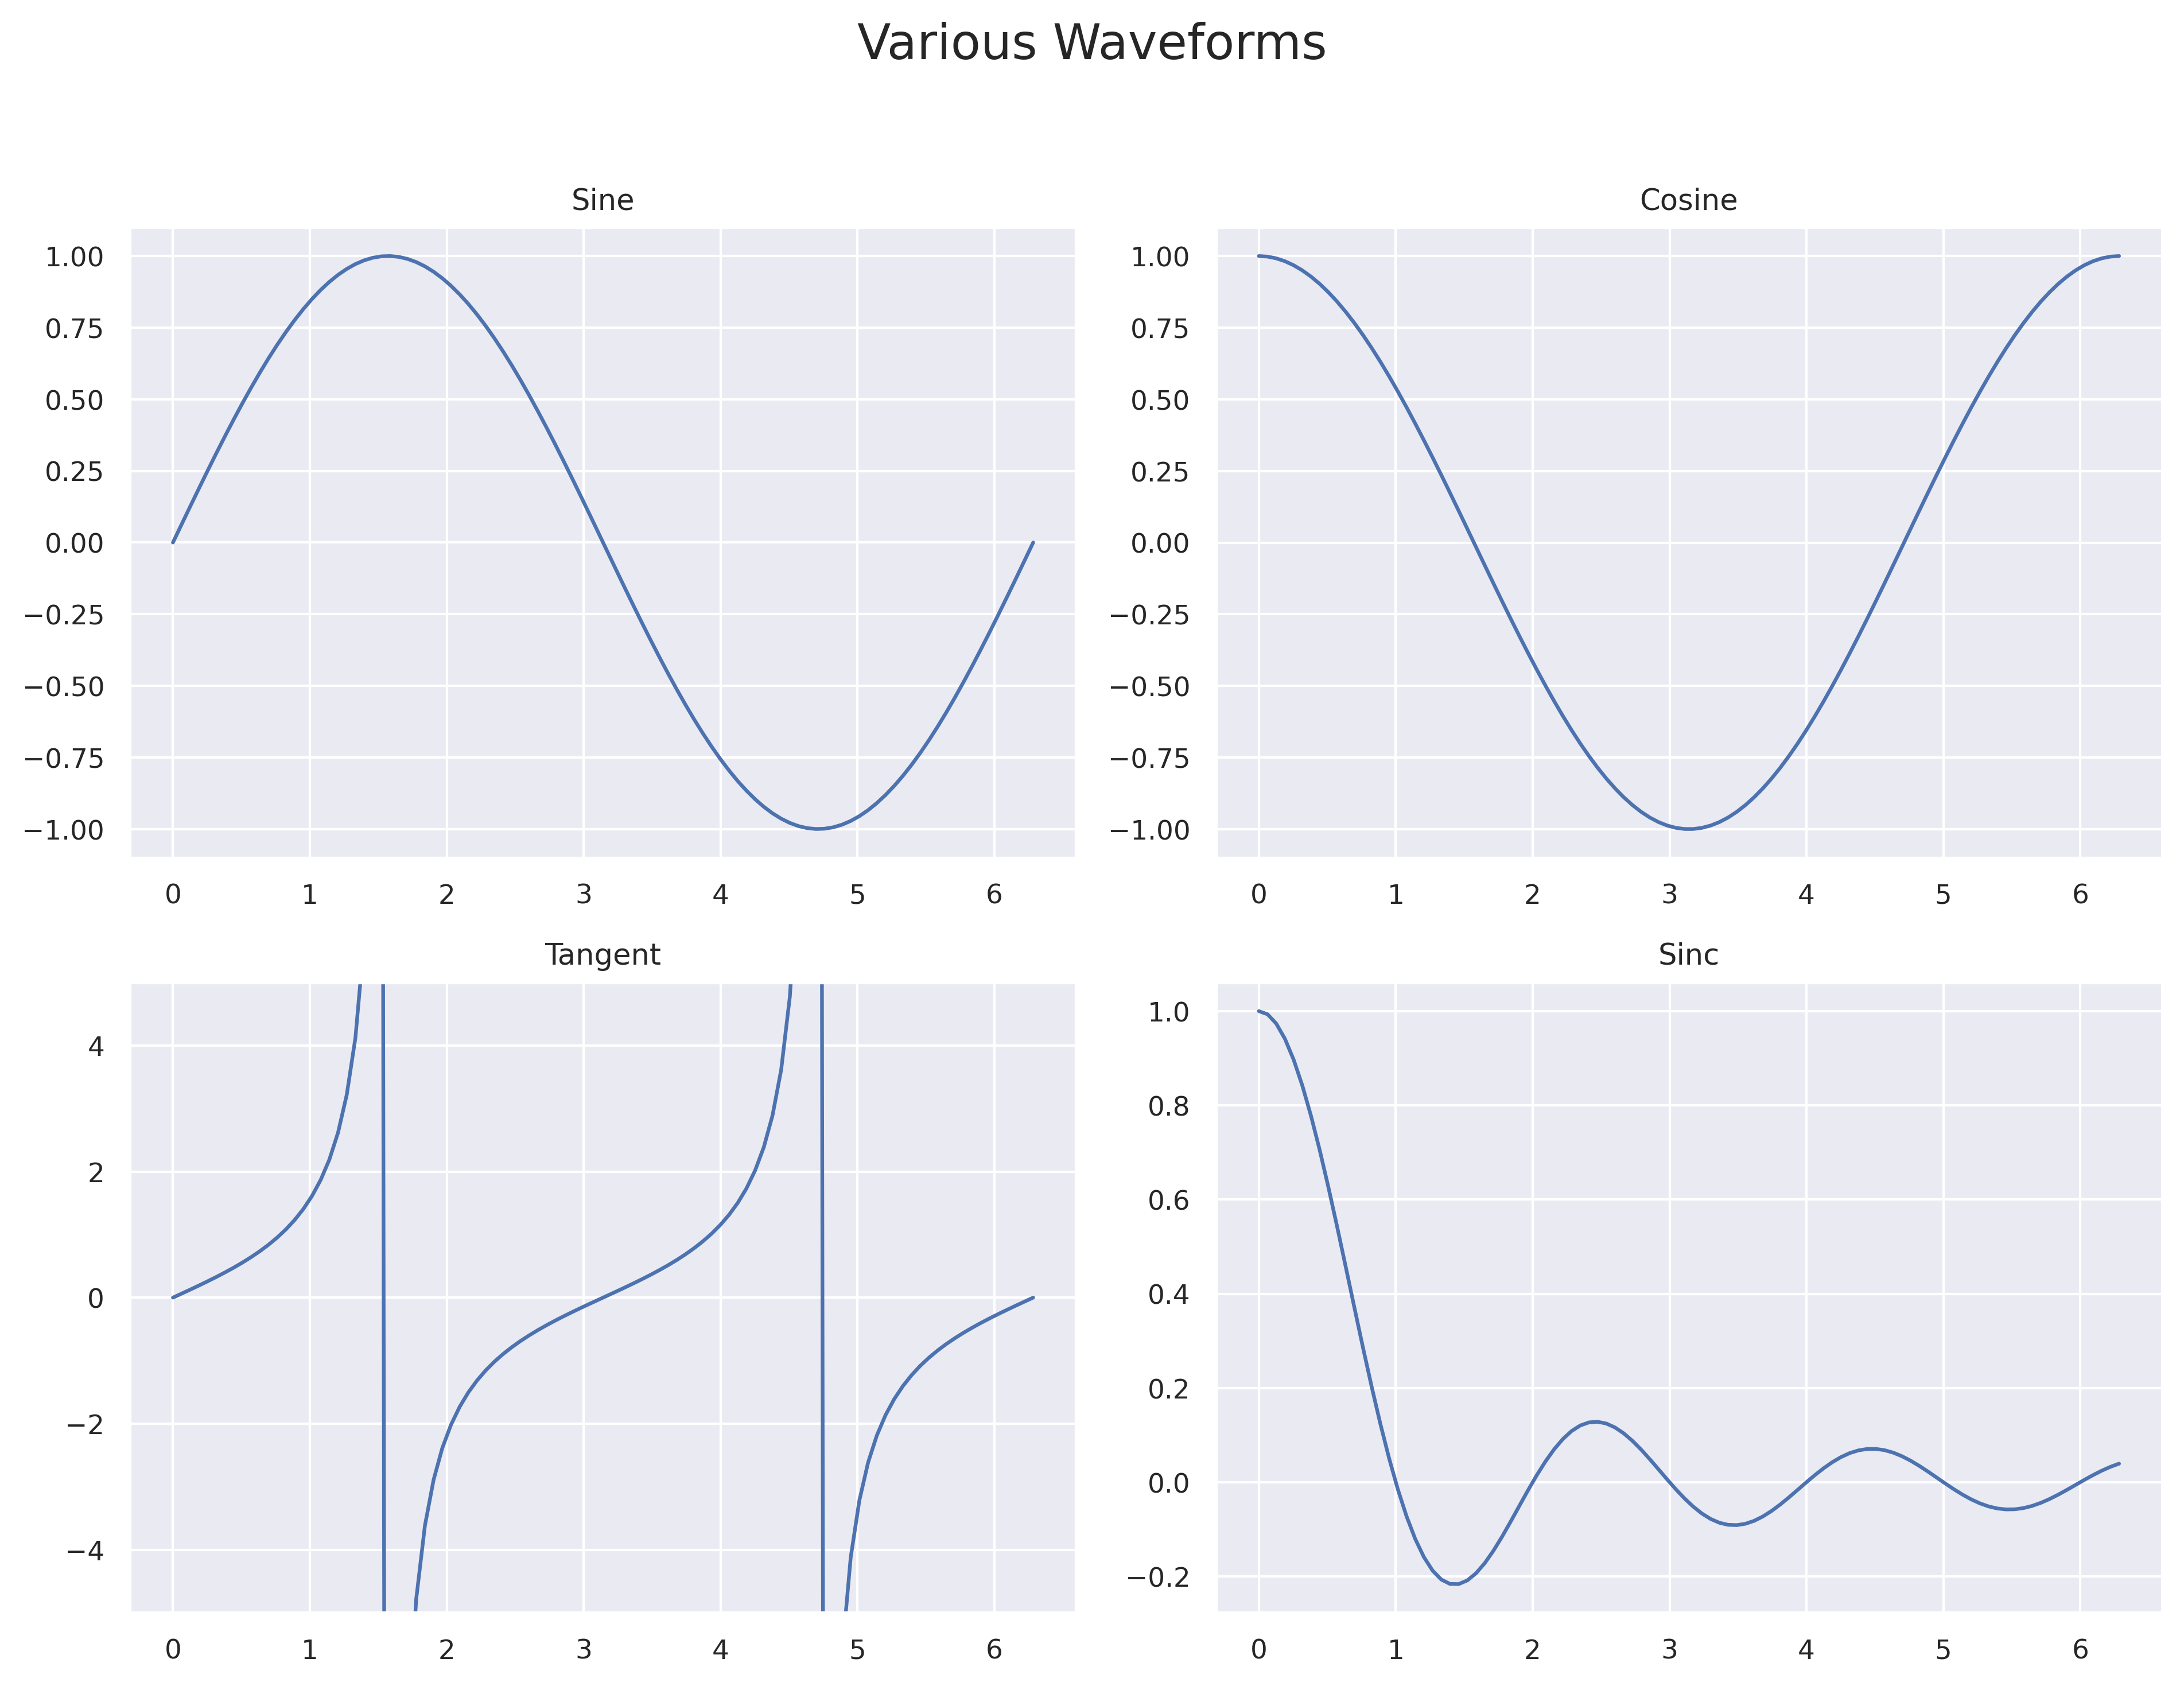
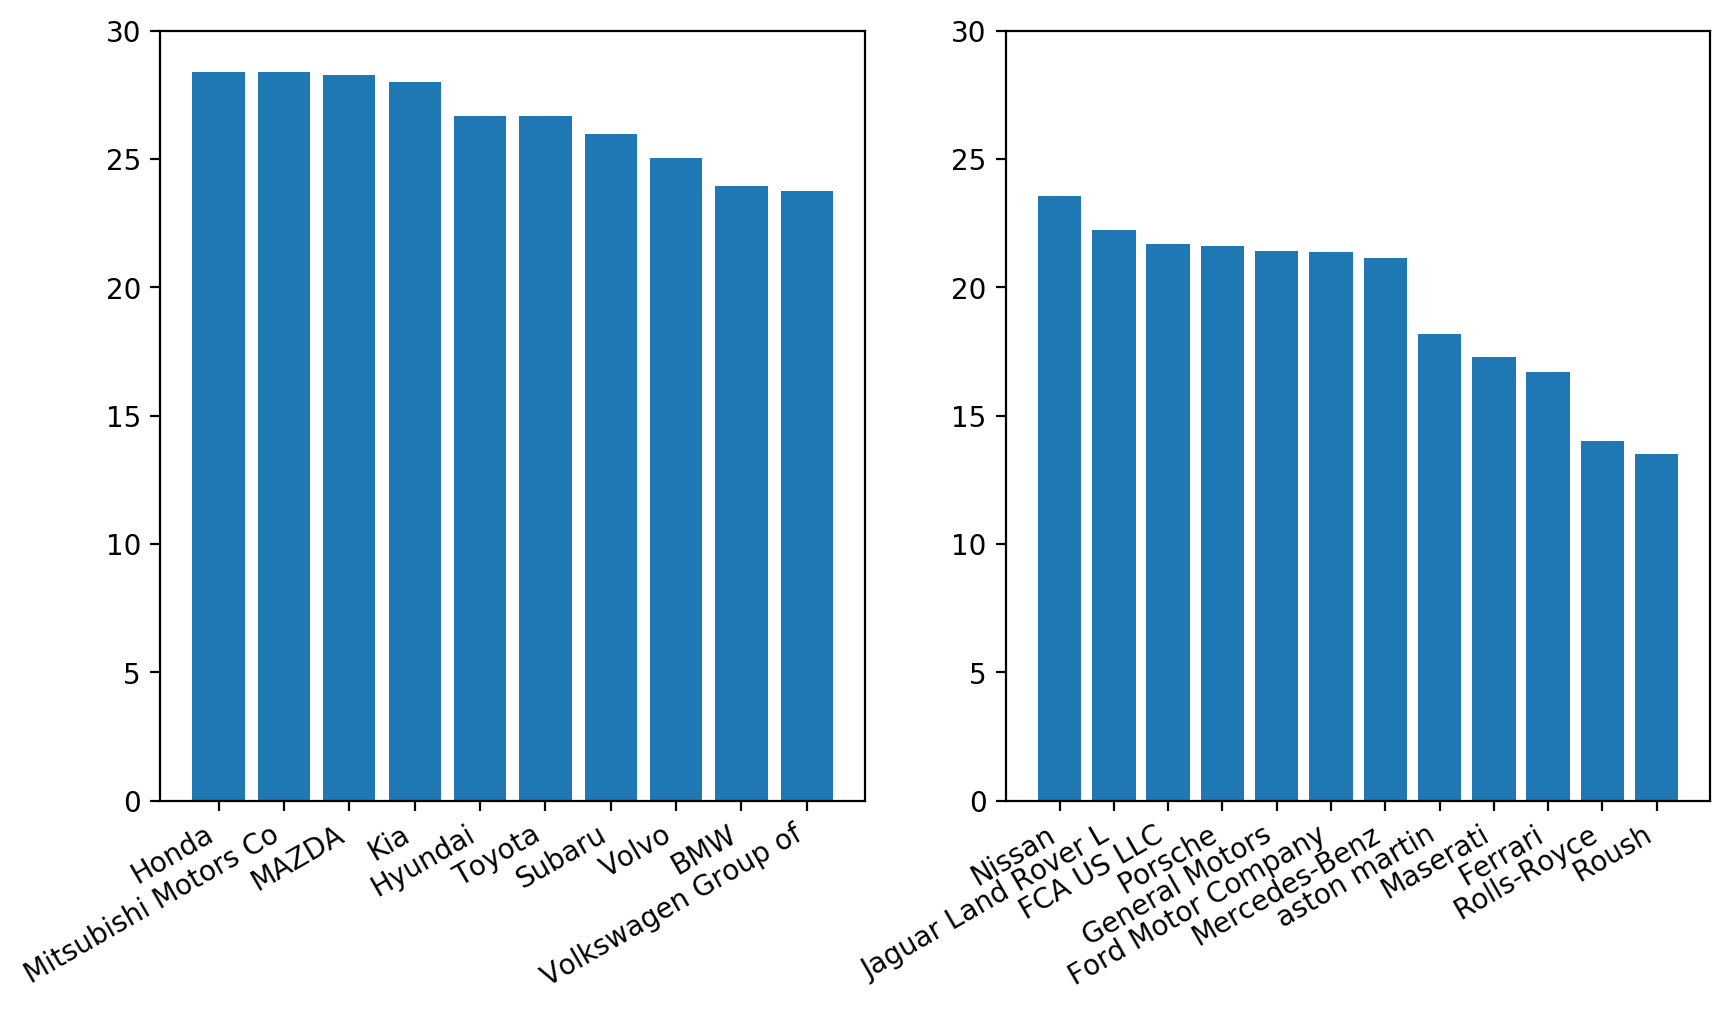
How to use subplots in Matplotlib to create multiple plots in a single figure
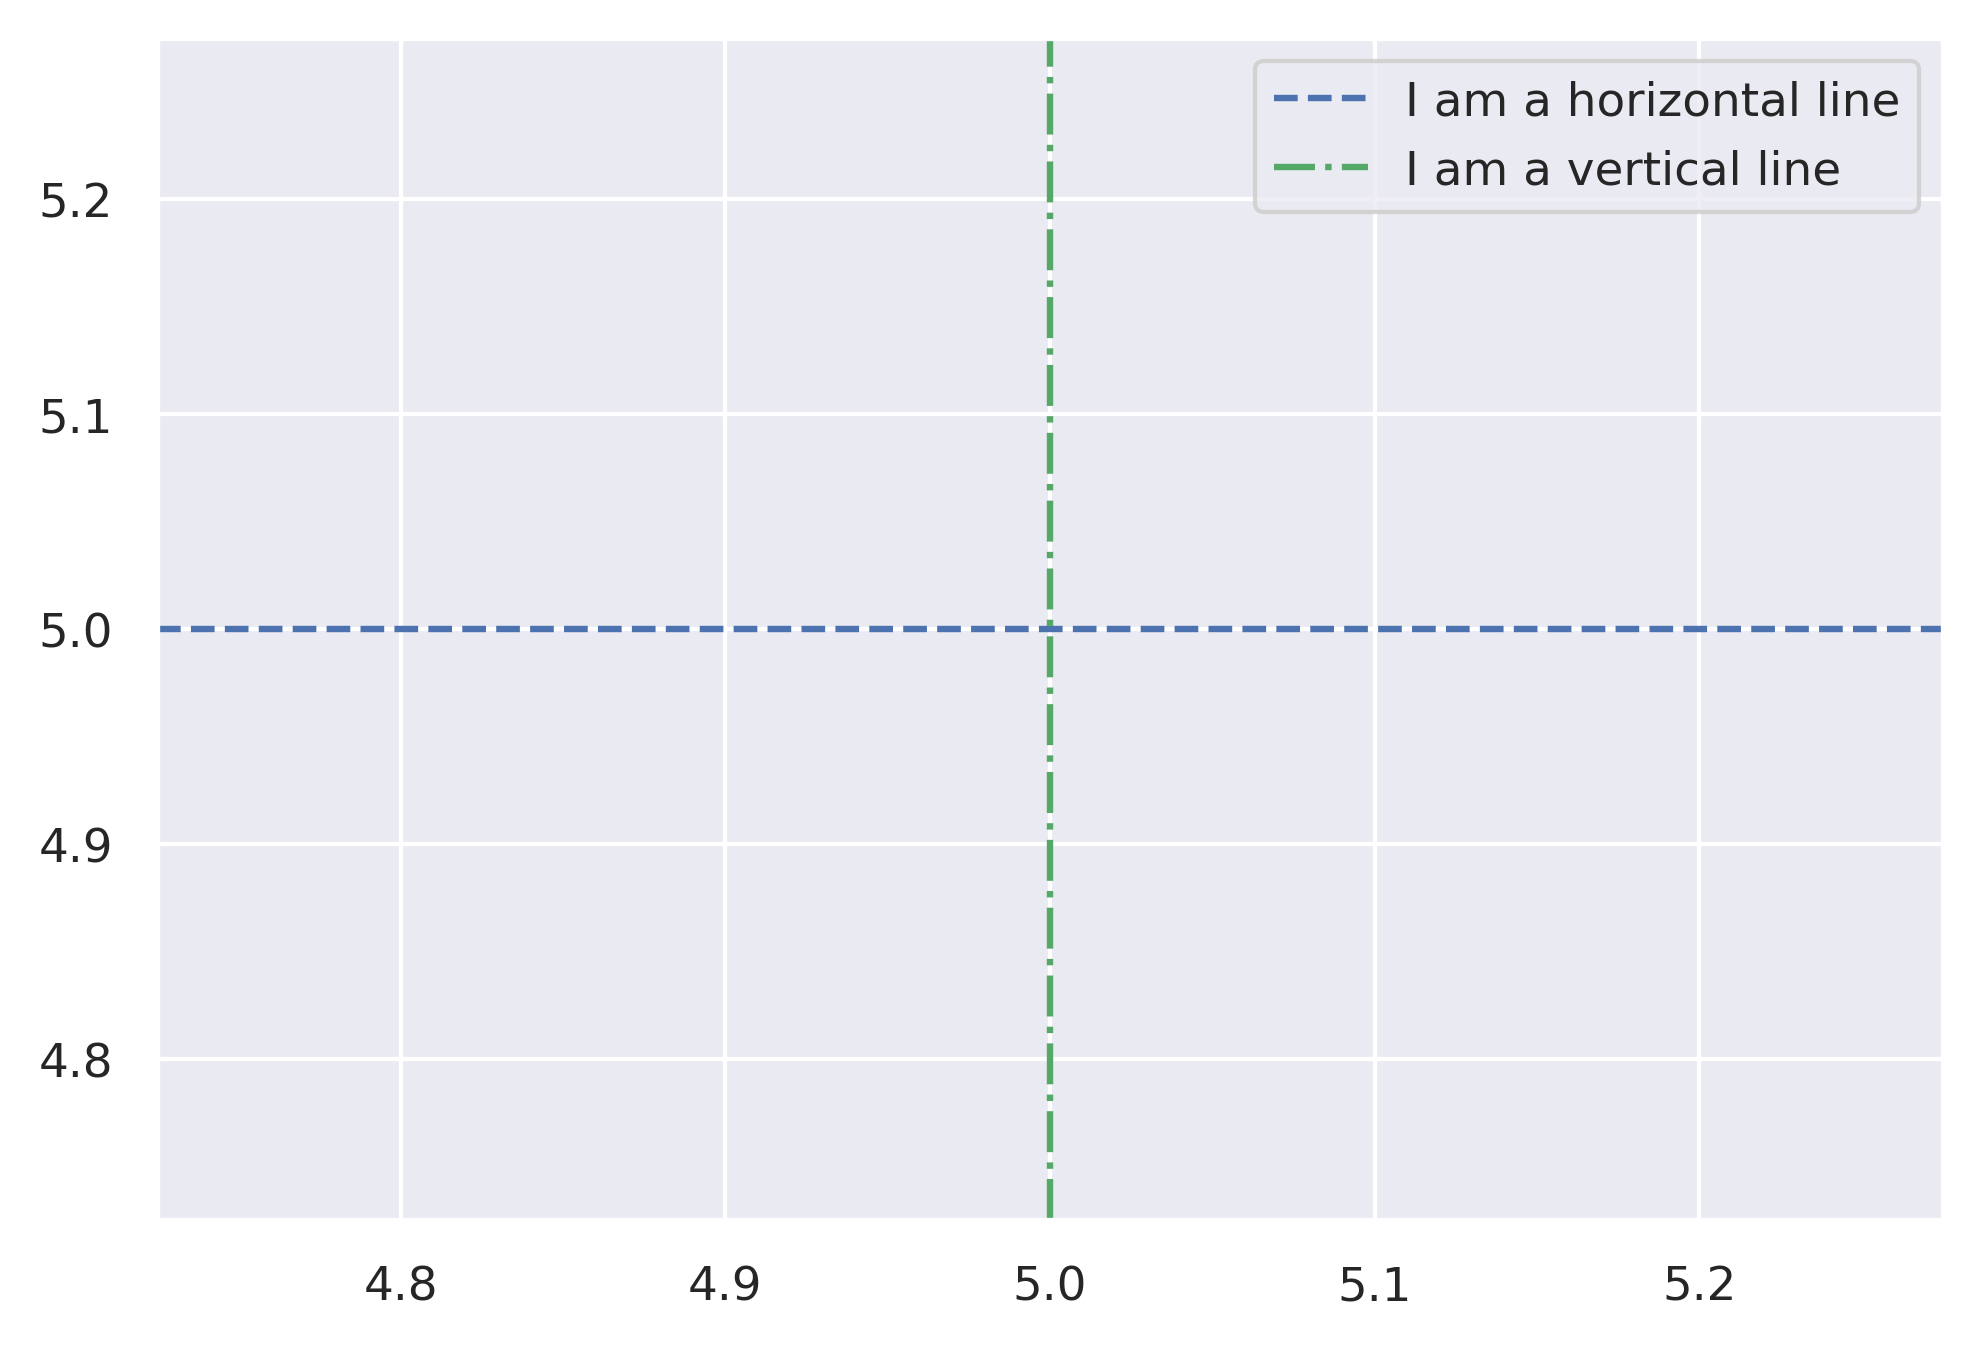
Annotating a Matplotlib chart with horizontal and vertical lines
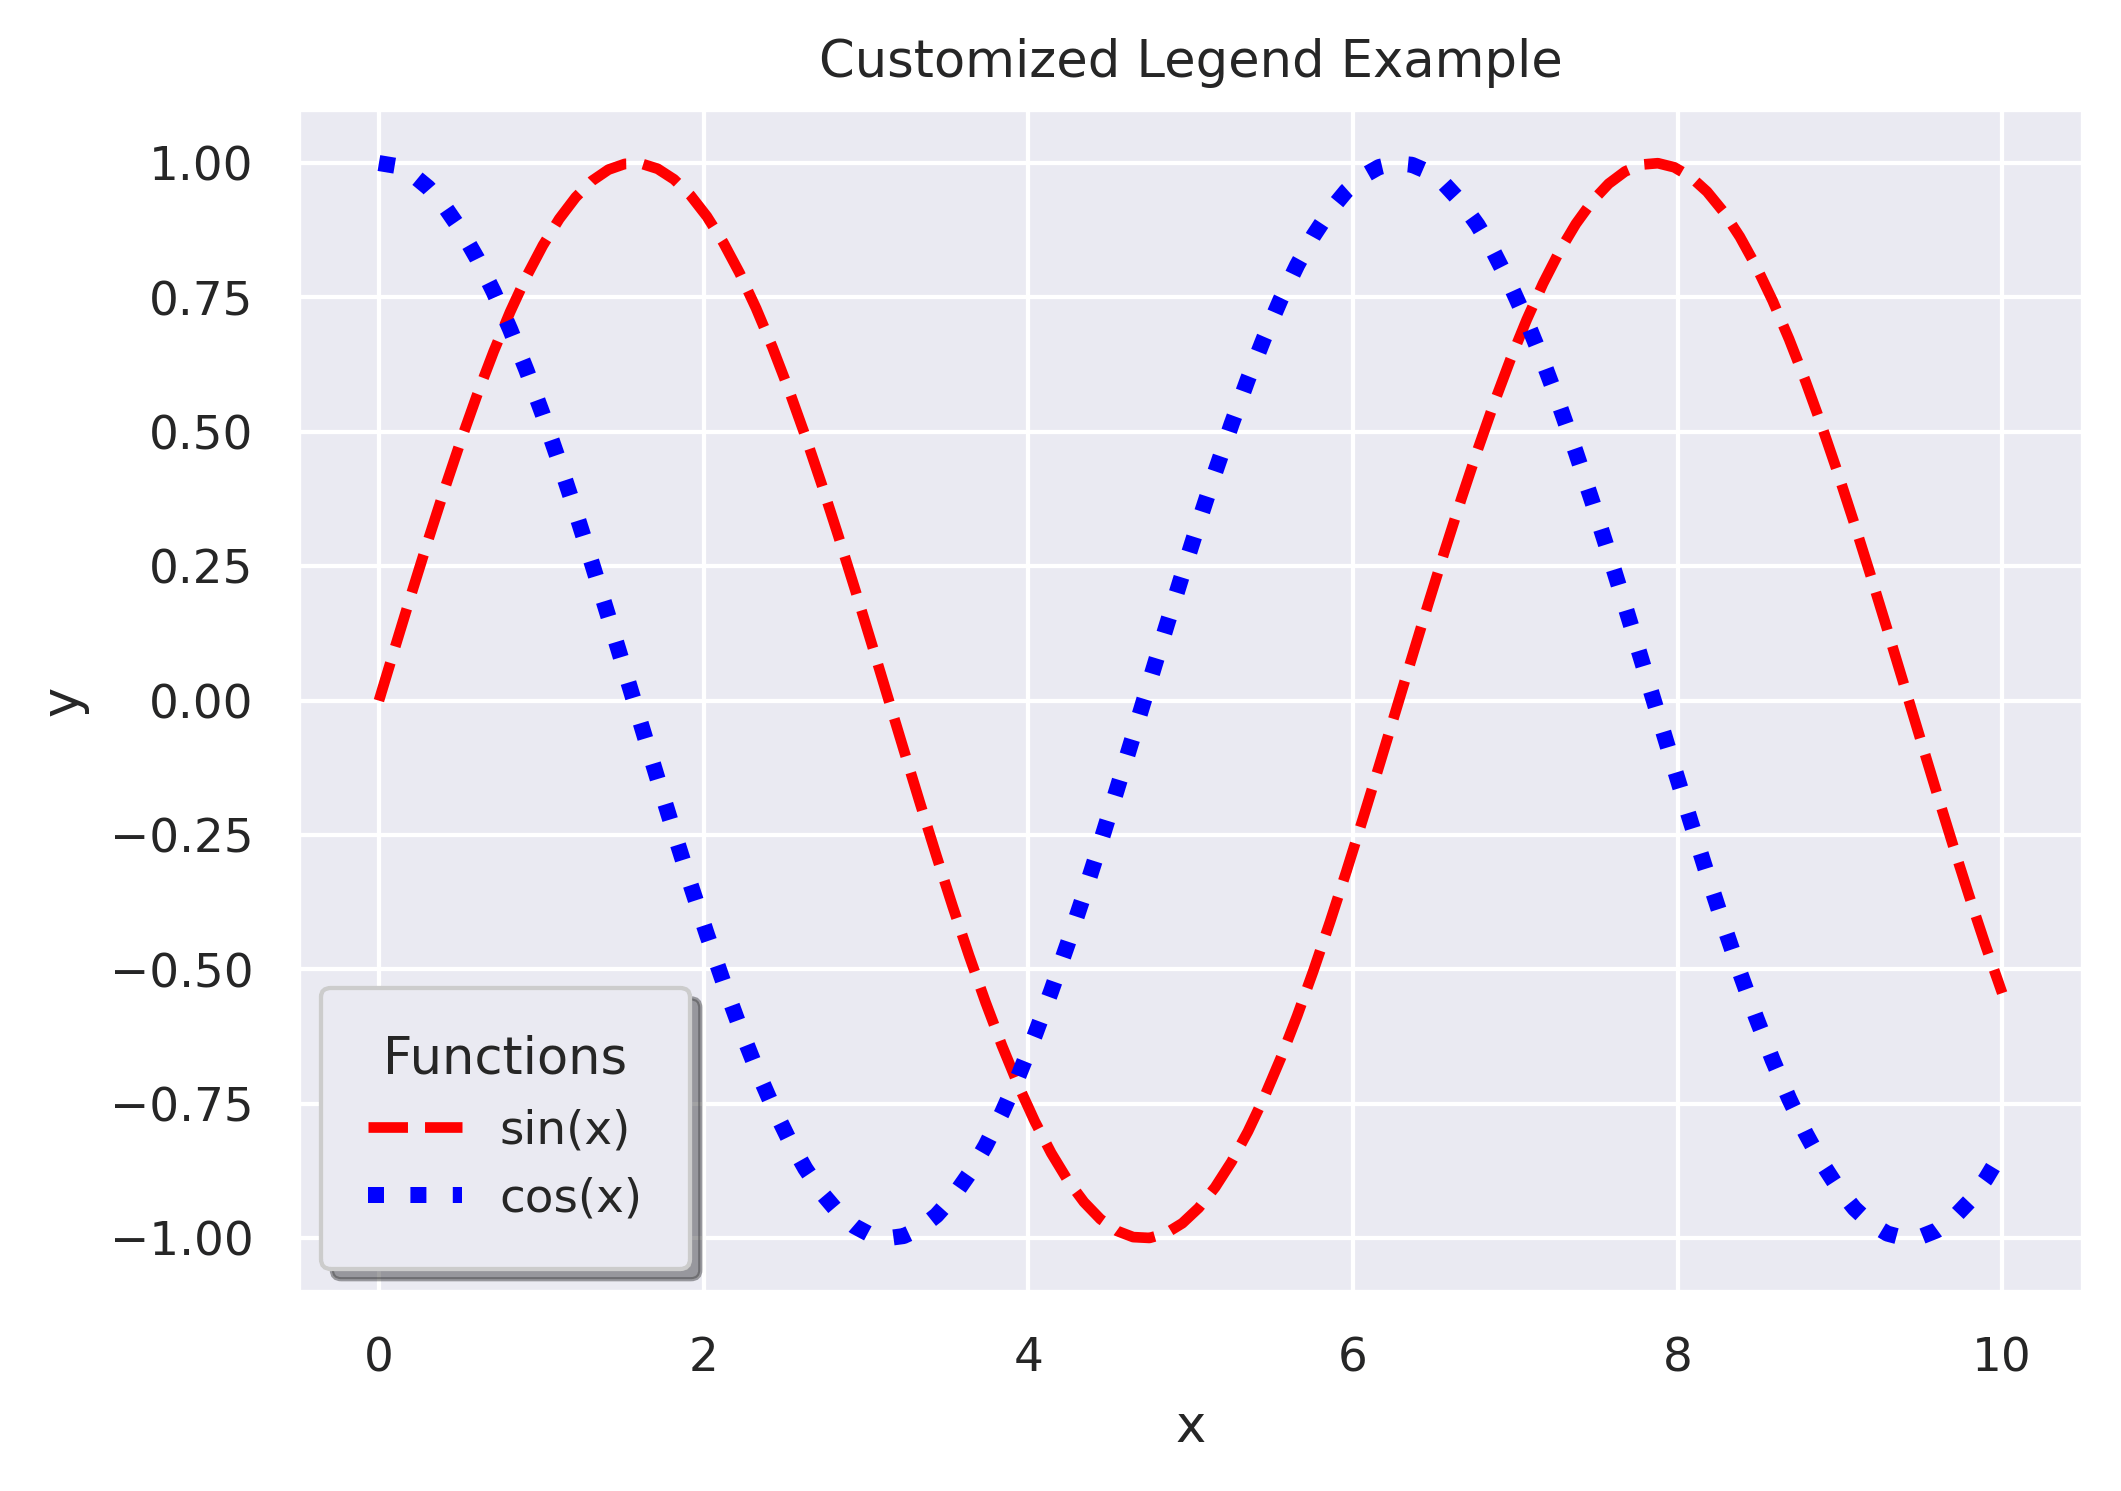
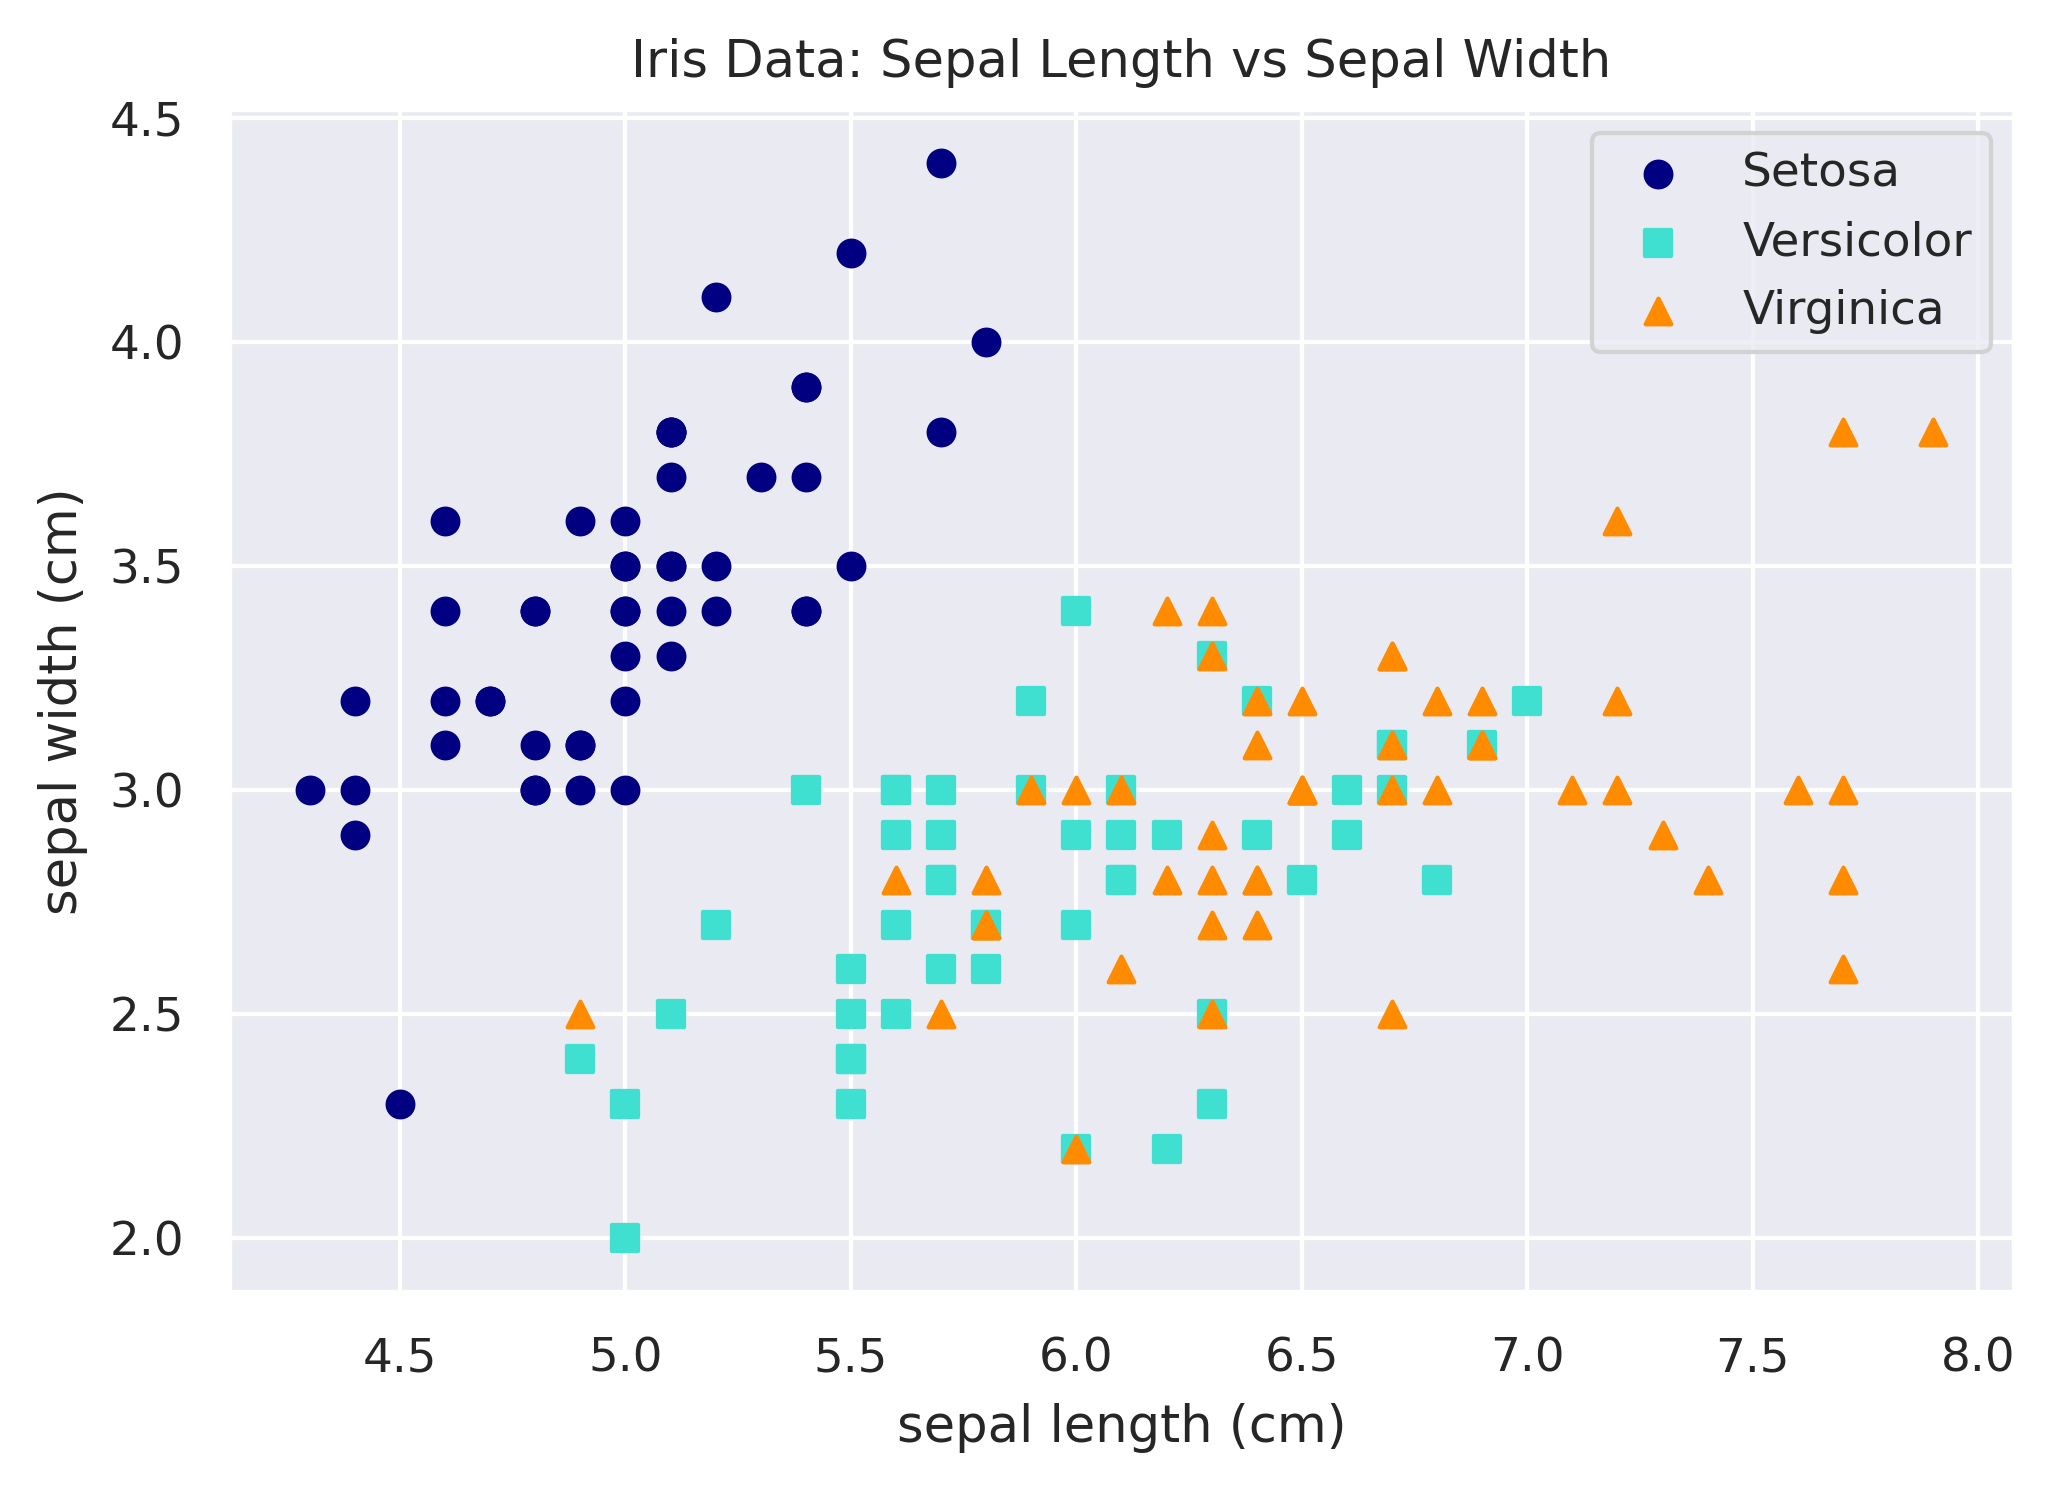
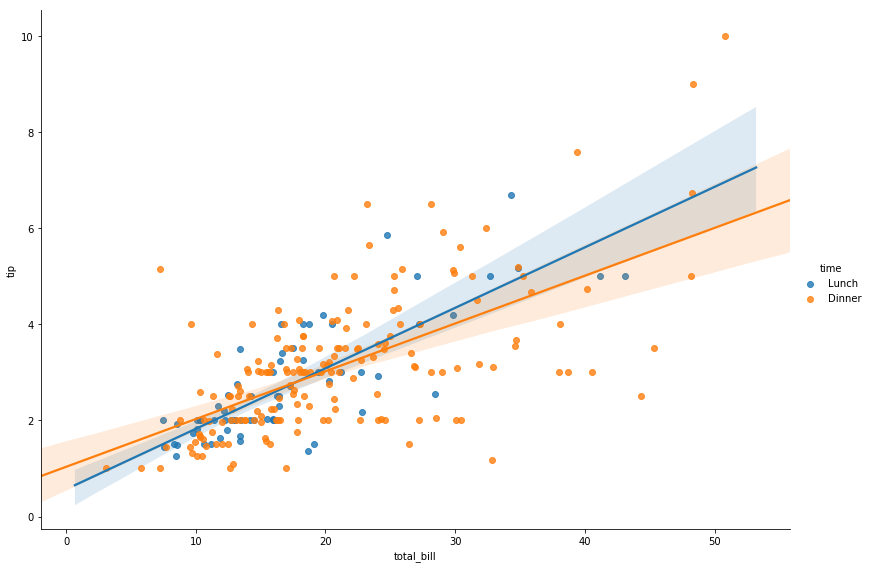
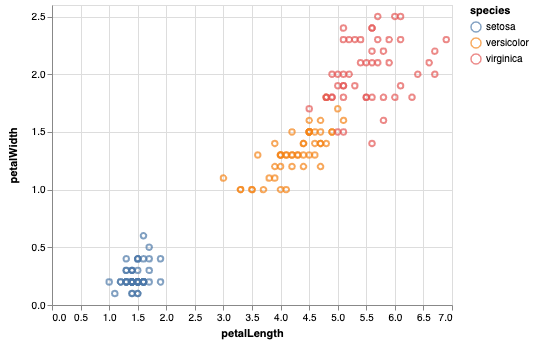
Adding a legend to a plot in Matplotlib and customizing the look and placement of it
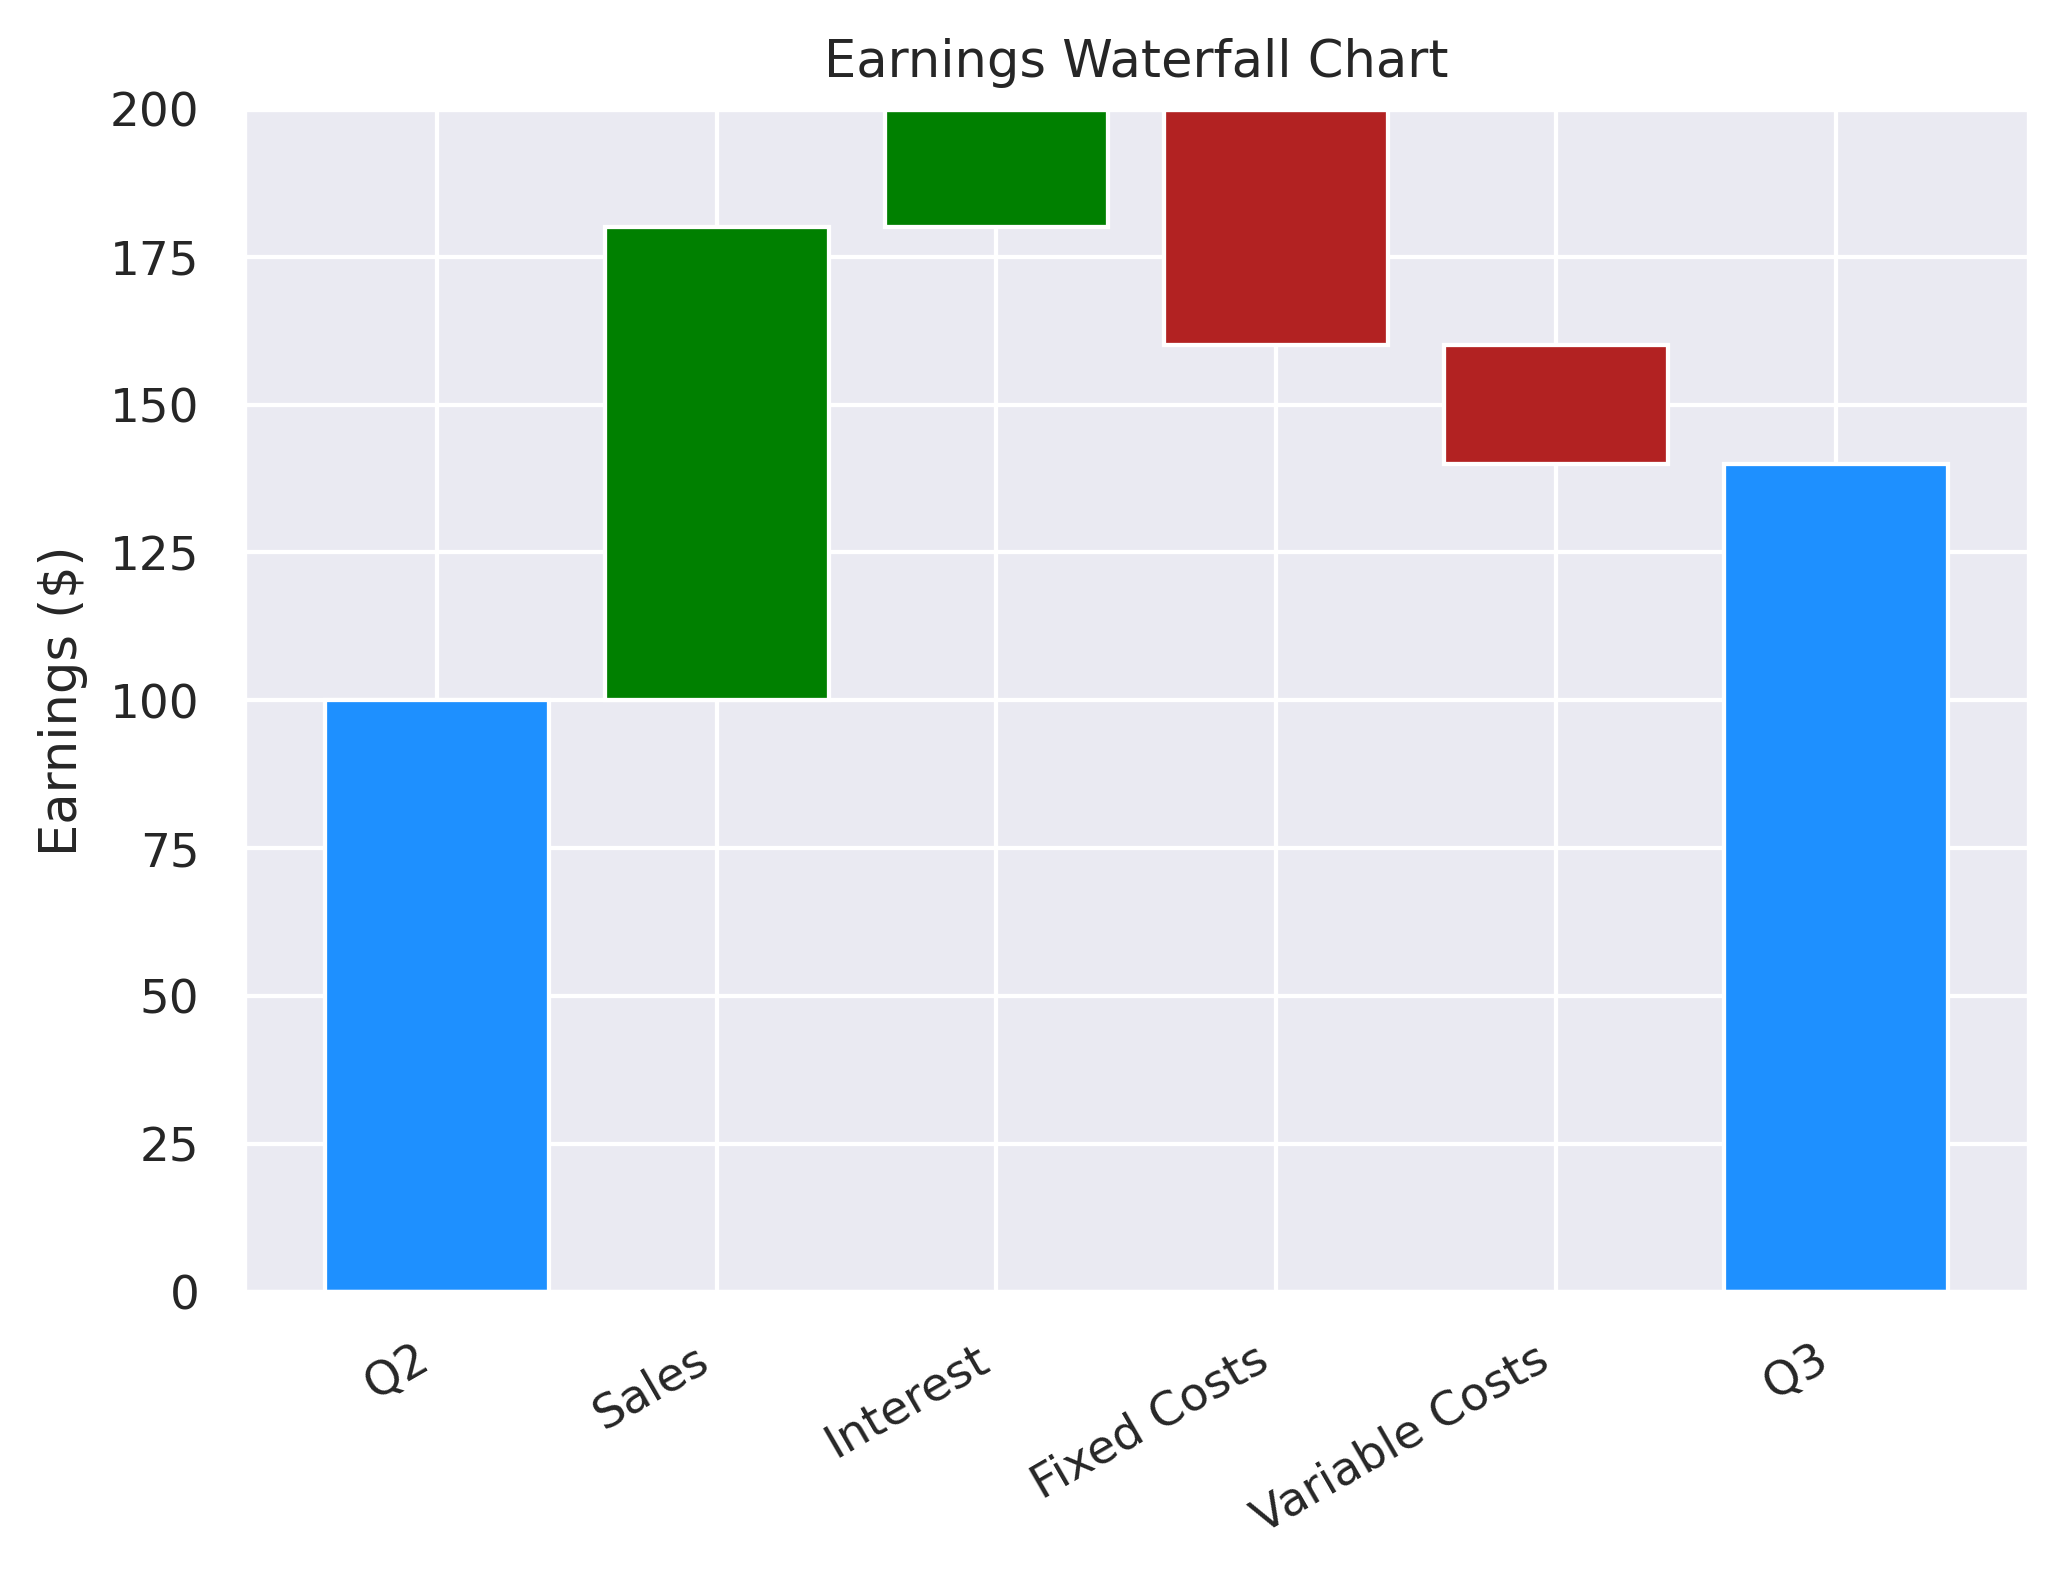
A quick tutorial of how to create waterfall charts in python, using Matplotlib and Plotly.
Learn how to customize and show the grid in Matplotlib charts
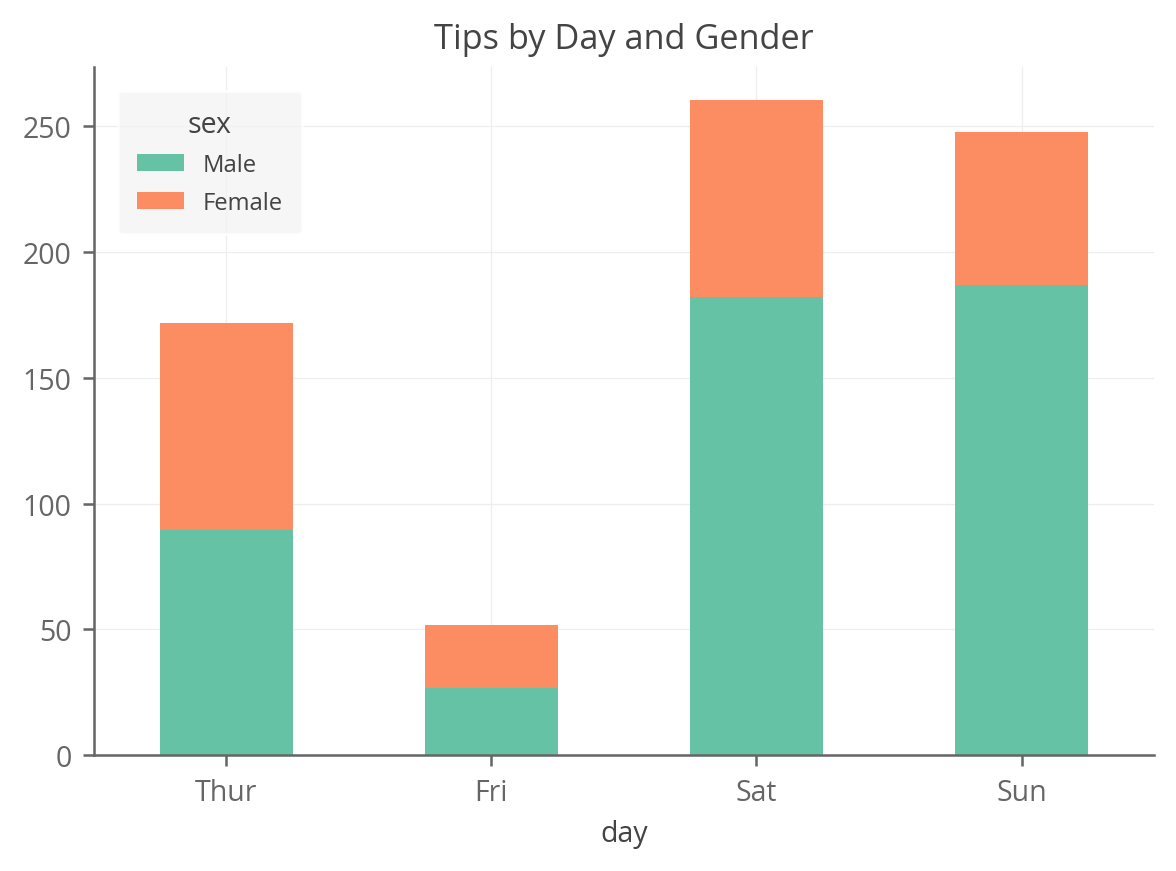
A complete guide to creating stacked bar charts in python using Pandas, Matplotlib, Seaborn, Plotnine and Altair
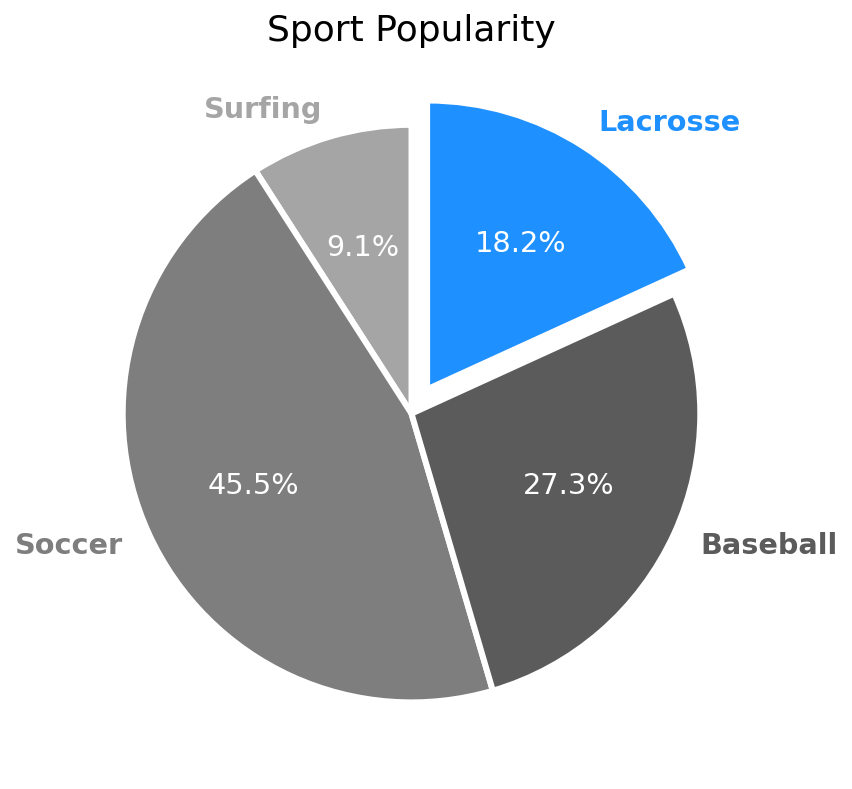
Creating pie charts with labels, custom styles and custom colors in Matplotlib
How to change the figure and plot size in Matplotlib
A look at all the ways you can rotate axis labels in Matplotlib
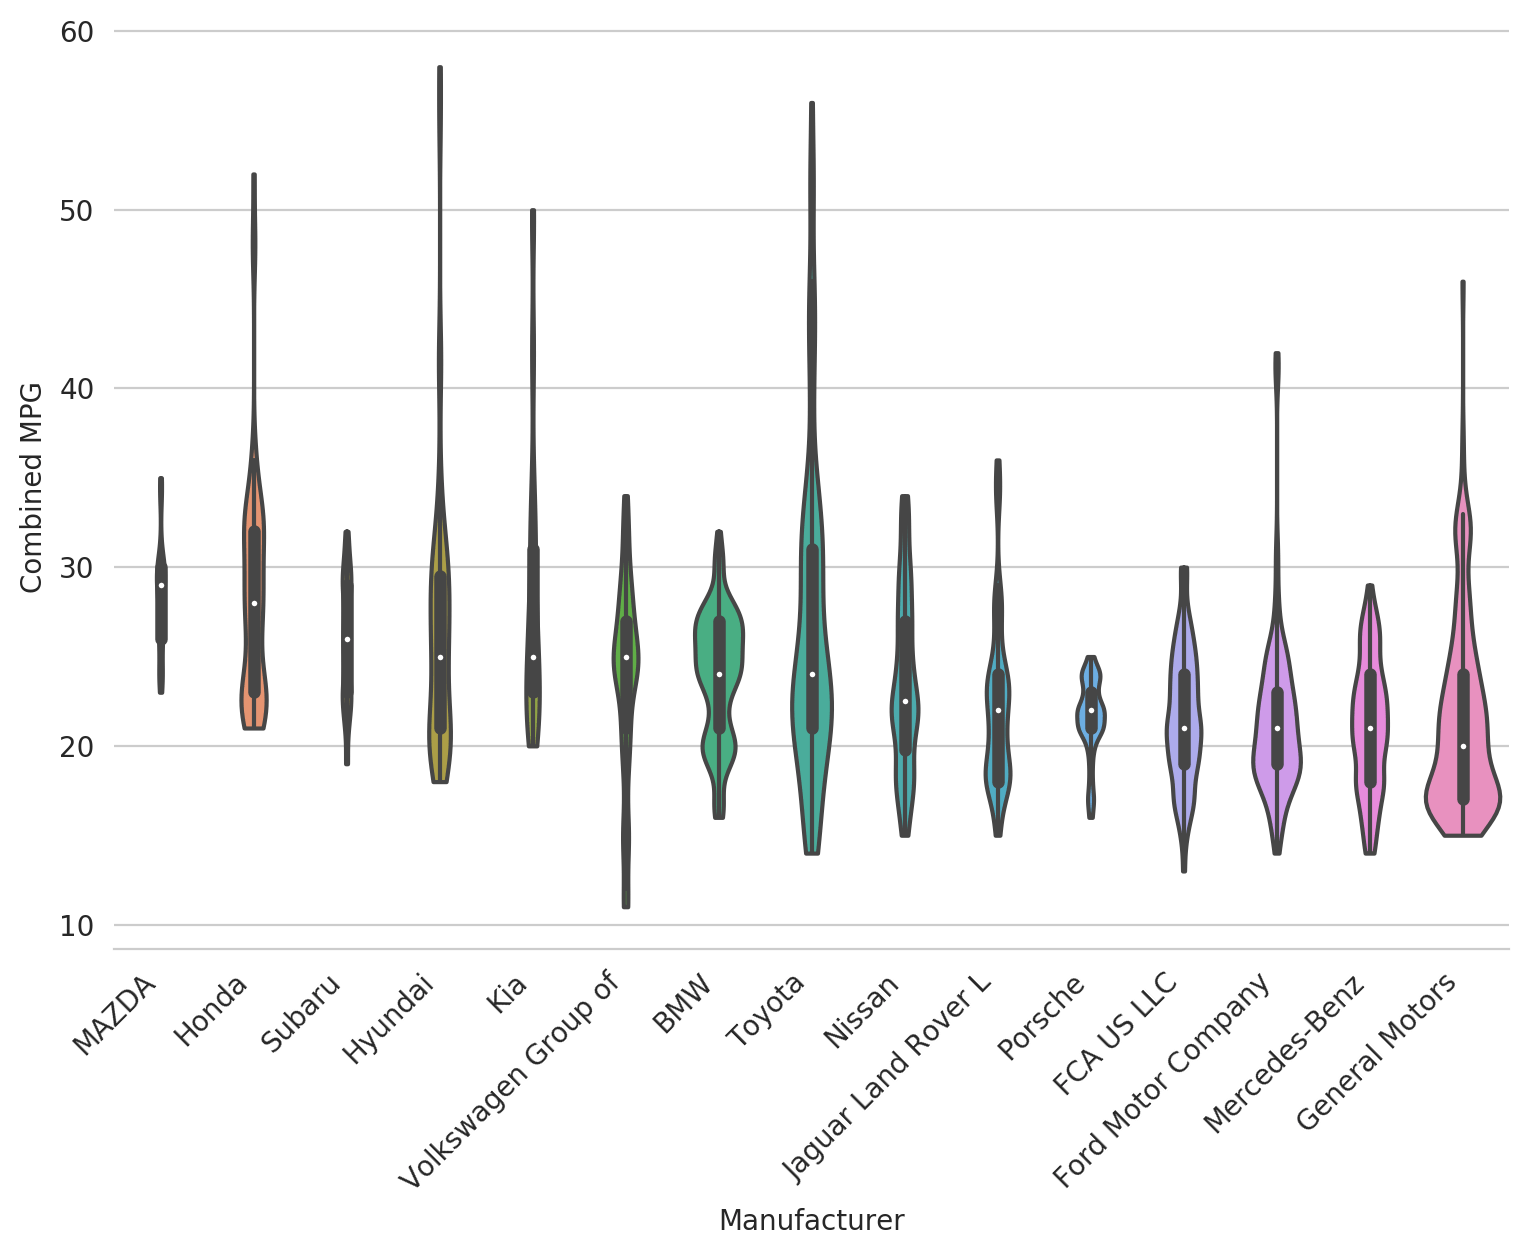
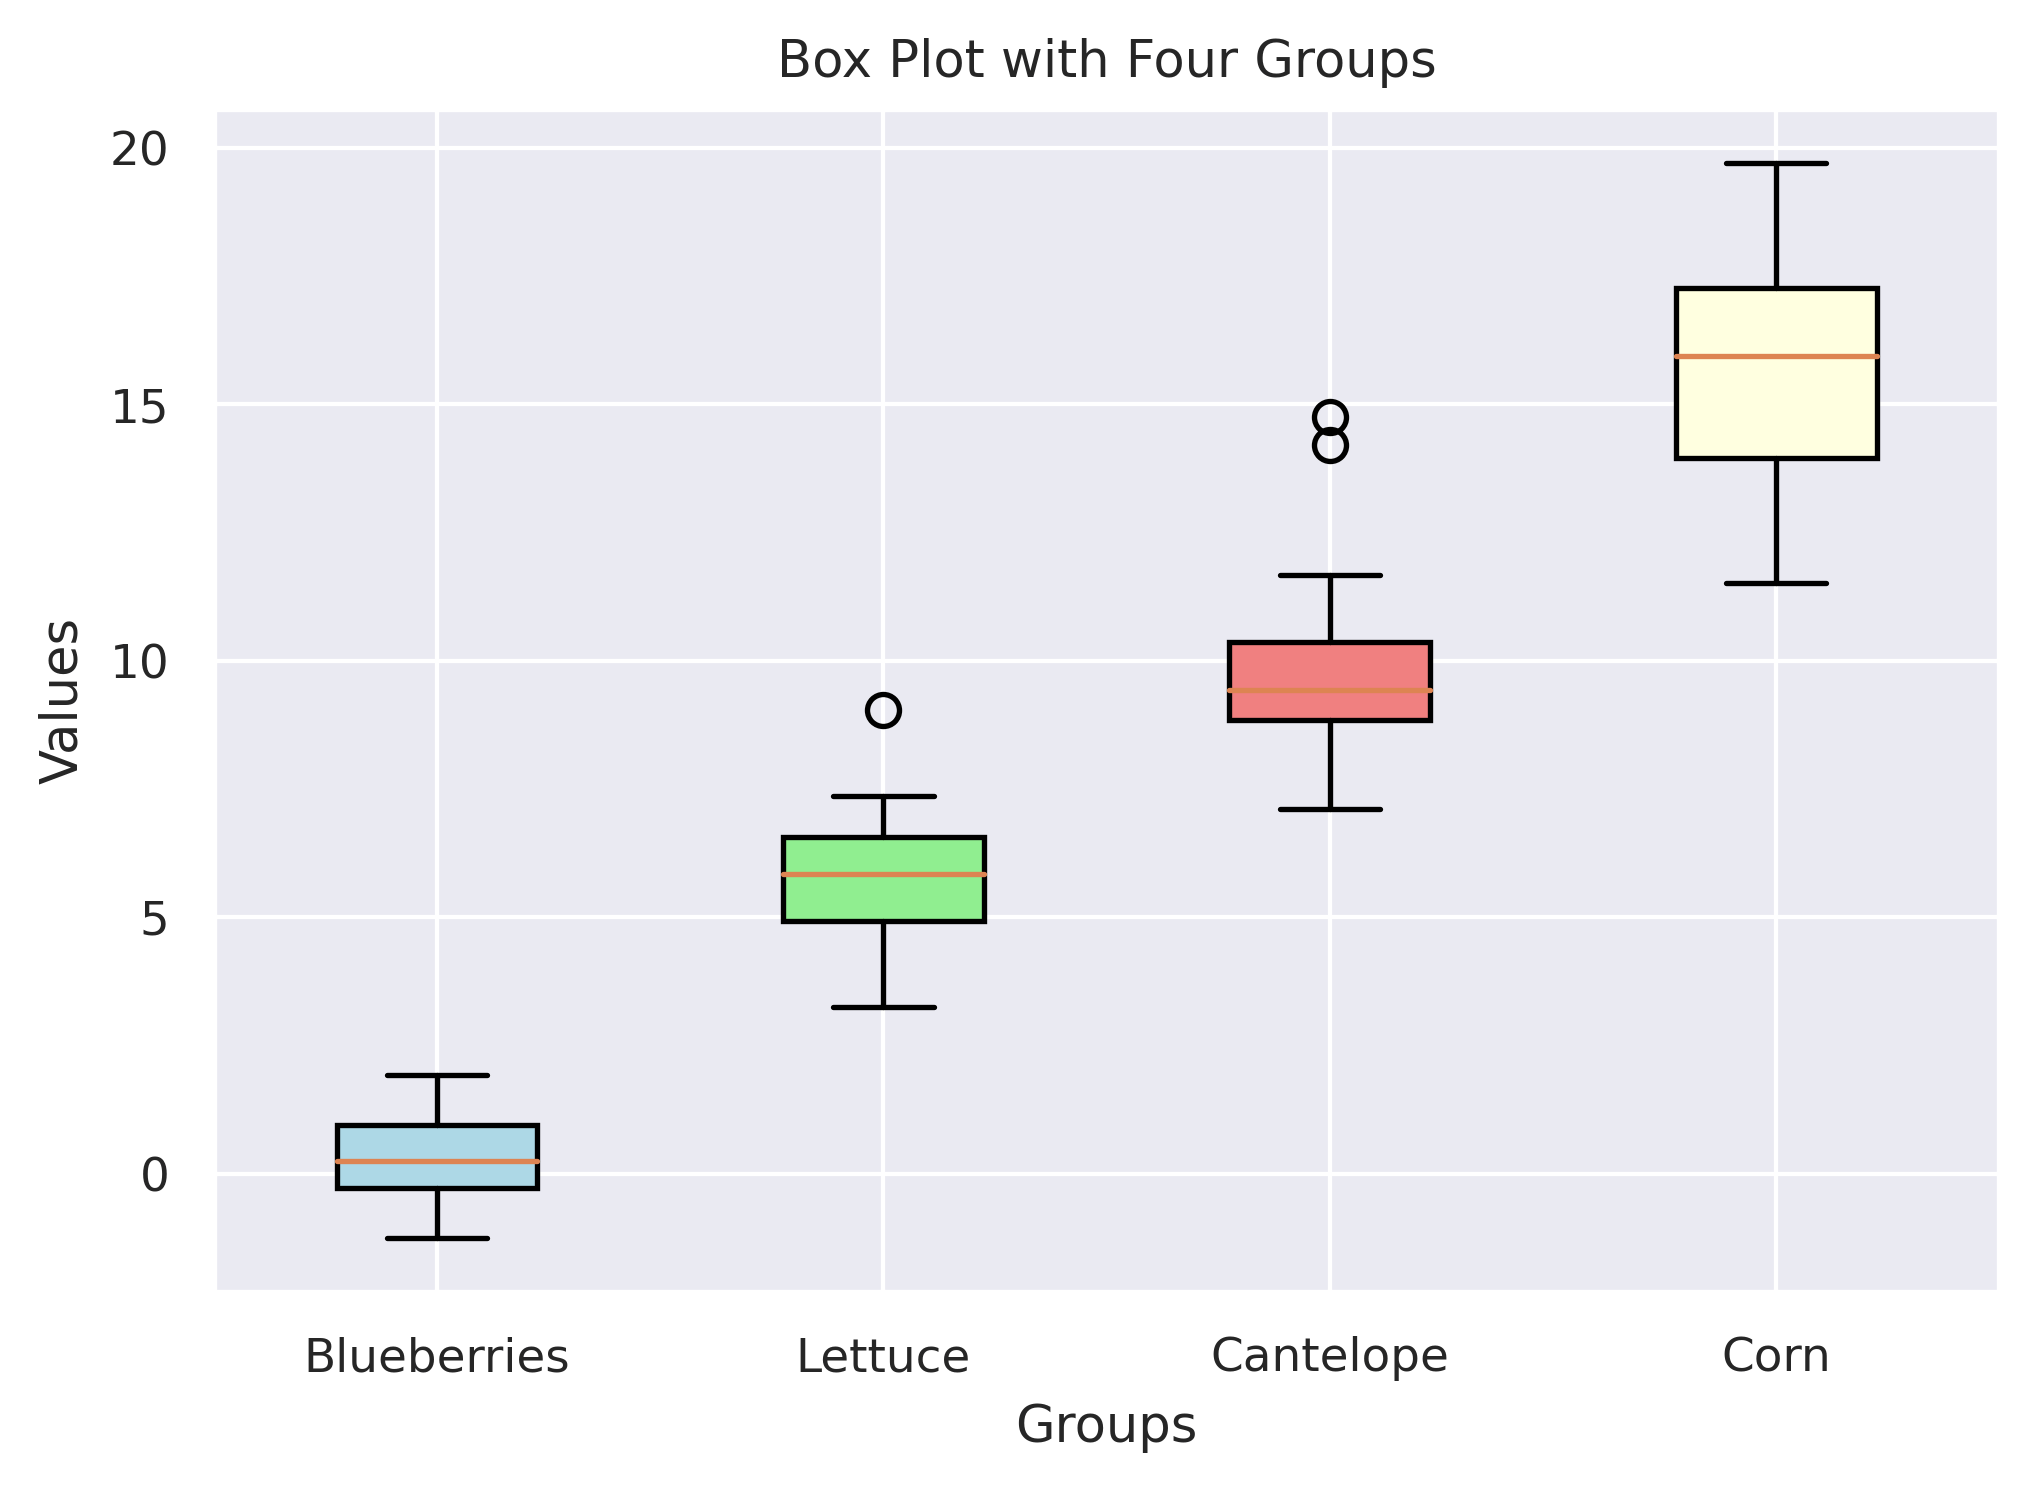
A short tutorial on creating and customizing violin plots in Seaborn
A brief introduction to the Altair Python visualization library