
TL;DR
import matplotlib.pyplot as plt
import numpy as np

x = np.linspace(0, 10, 100)
y = np.sin(x)
fig, ax = plt.subplots()
ax.plot(x, y)
ax.set_title('Sine Wave', fontsize=16, fontweight='bold', color='darkslategray')
fig.suptitle('Styled title, subtitle, footnote', fontsize=12, color='gray')
fig.text(0.99, 0.01, 'Source: generated data', ha='right', va='bottom', fontsize=9, color='dimgray')
plt.show()
Why style titles?
A clear, well‑styled title tells viewers what the plot is about. A subtitle can add context, and a footnote can cite data sources or notes.
Adding a main title
Use ax.set_title() to control the text, size, weight, and colour of the main title.
ax.set_title(
    'Sine Wave',
    fontsize=16,
    fontweight='bold',
    color='darkslategray'
)
Adding a subtitle
Matplotlib does not have a dedicated subtitle API, but fig.suptitle() works well for a secondary line. Position it at the top of the figure and style it separately.
fig.suptitle(
    'Styled title, subtitle, footnote',
    fontsize=12,
    color='gray'
)
Adding a footnote
Place a footnote in the bottom‑right corner with fig.text(). Adjust the alignment and colour to keep it subtle.
fig.text(
    0.99, 0.01,
    'Source: generated data',
    ha='right', va='bottom',
    fontsize=9,
    color='dimgray'
)
Putting it together – a polished example
import matplotlib.pyplot as plt
import numpy as np

x = np.linspace(0, 10, 100)
y = np.sin(x)

fig, ax = plt.subplots(figsize=(8, 5))
ax.plot(x, y, color='tab:blue')

# Main title
ax.set_title('Styled Sine Wave', fontsize=18, fontweight='semibold', color='#2E4053')
# Subtitle
fig.suptitle('Using rcParams for consistent styling', fontsize=14, color='#566573')
# Footnote
fig.text(0.99, 0.01, 'Generated on 2026‑08‑10', ha='right', va='bottom', fontsize=10, color='#839192')

plt.tight_layout(rect=[0, 0.03, 1, 0.95])
plt.savefig('images/matplotlib-title-styles-styled.png', dpi=150)
plt.show()
Result
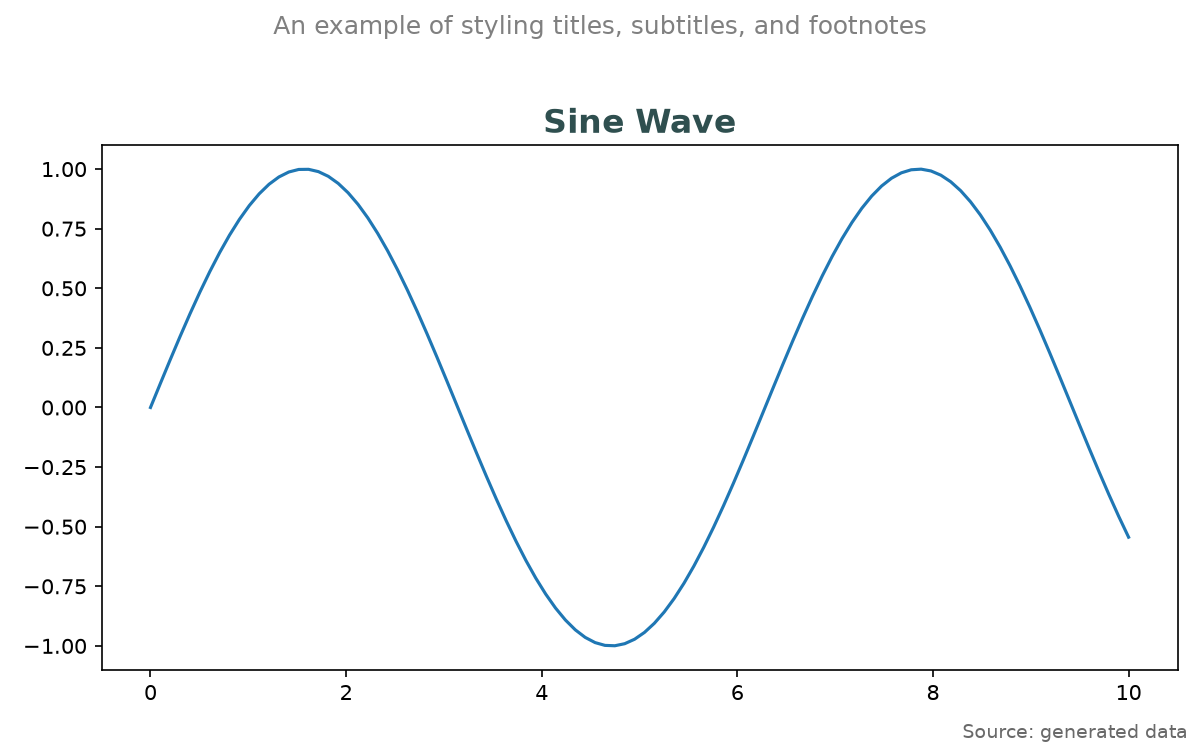
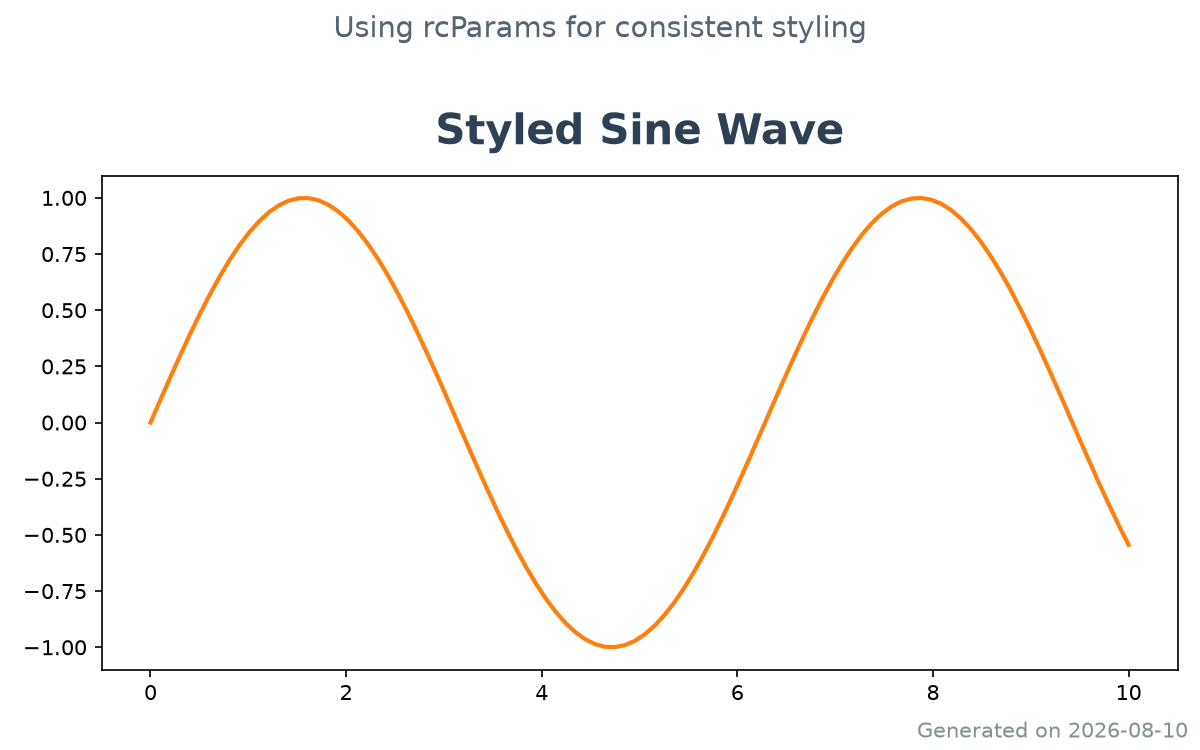
TL;DR recap
ax.set_title()— main title (size, weight, colour).fig.suptitle()— subtitle (independent styling).fig.text()— footnote at any figure coordinate.- Use
plt.tight_layout()andrectto avoid clipping.
Happy plotting!