
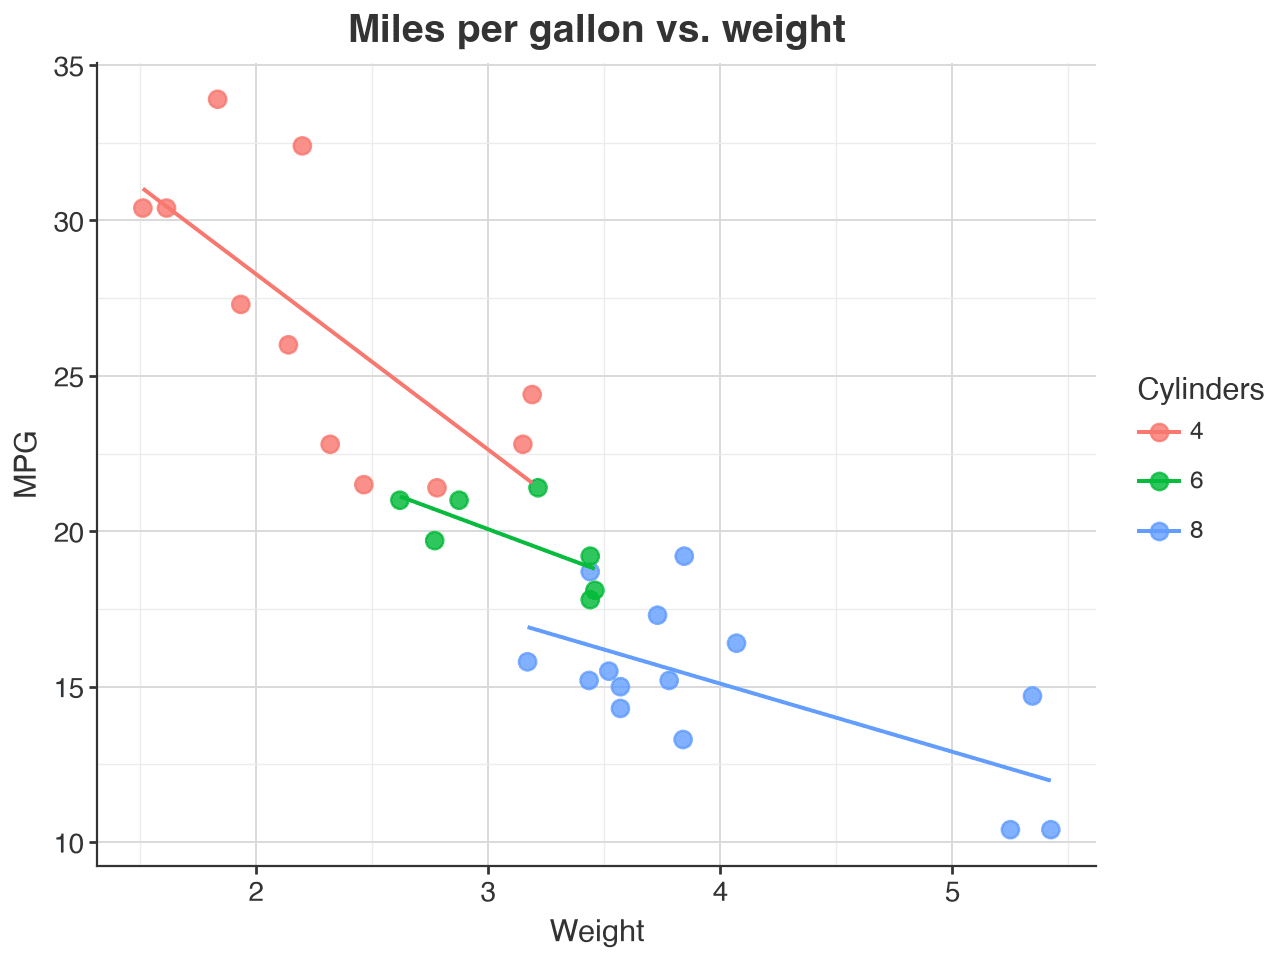
Plotnine
How to Custom Theme Plotnine Graphs to Match ggplot2
A simple Plotnine theme recipe for making charts feel closer to ggplot2 without rewriting your plots.
A simple Plotnine theme recipe for making charts feel closer to ggplot2 without rewriting your plots.
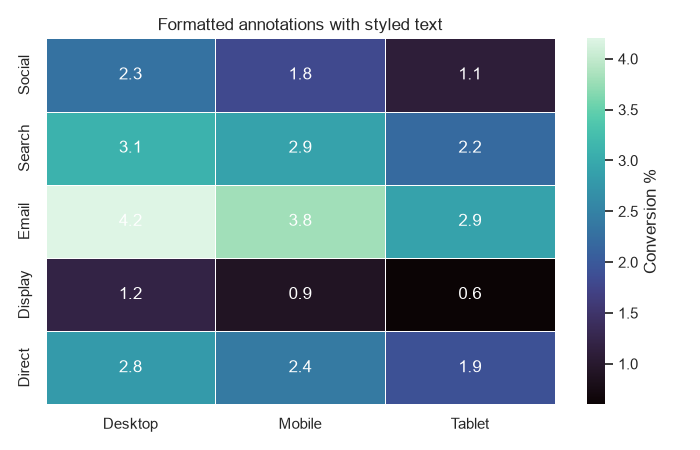
Style Seaborn heatmaps by annotating values, formatting labels, and masking cells you want to hide.
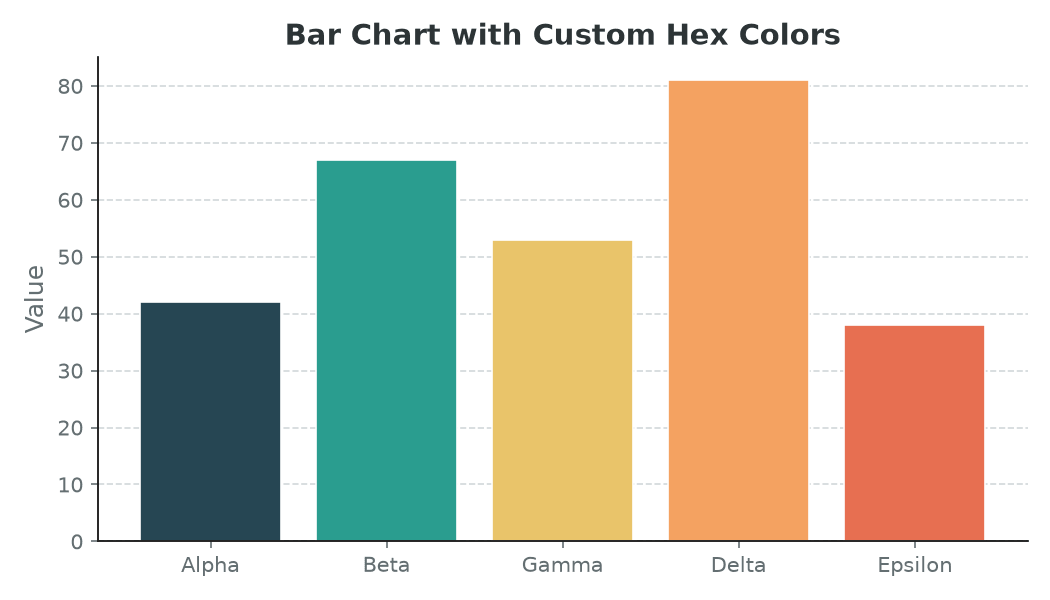
How to use hex color codes and custom RGB tuples to give Matplotlib charts a polished, on-brand look.
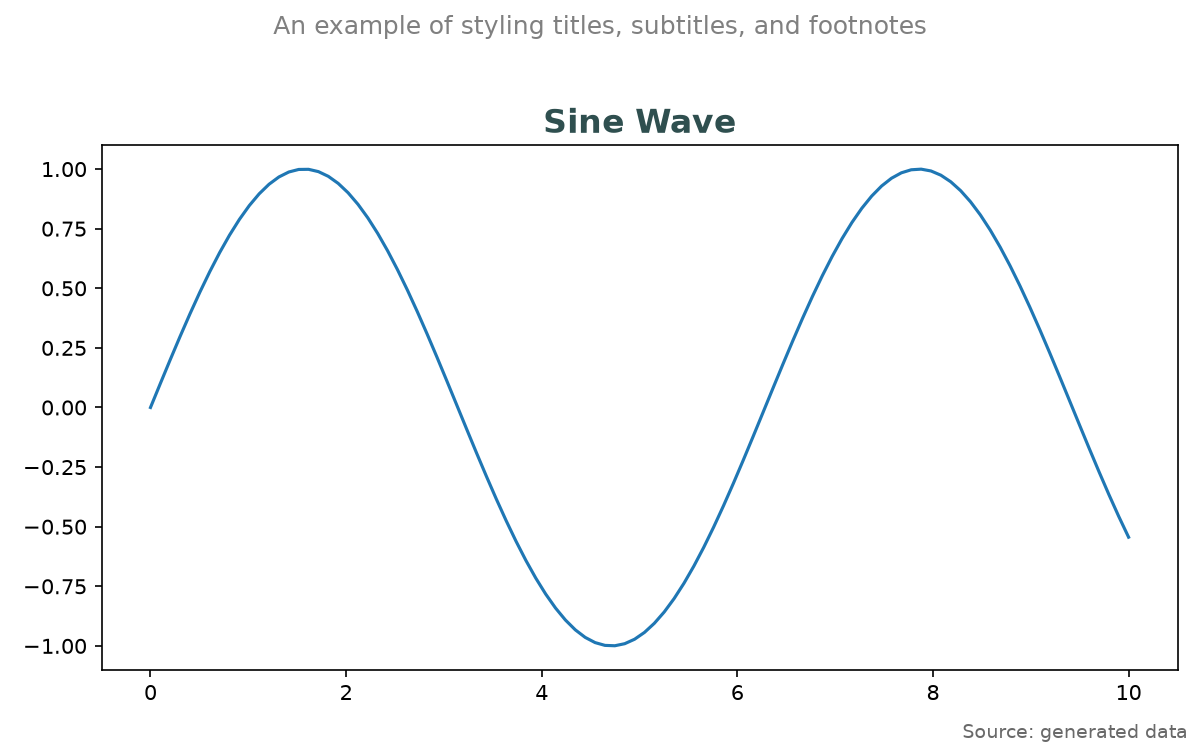
Quick guide to styling the main title, subtitle, and footnote of a Matplotlib figure.