
Seaborn
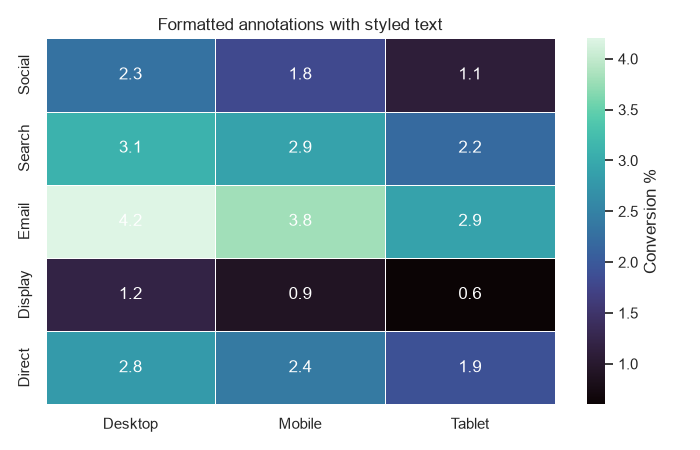
How to Style Seaborn Heatmaps (Annotate Values, Masking)
Style Seaborn heatmaps by annotating values, formatting labels, and masking cells you want to hide.
Style Seaborn heatmaps by annotating values, formatting labels, and masking cells you want to hide.
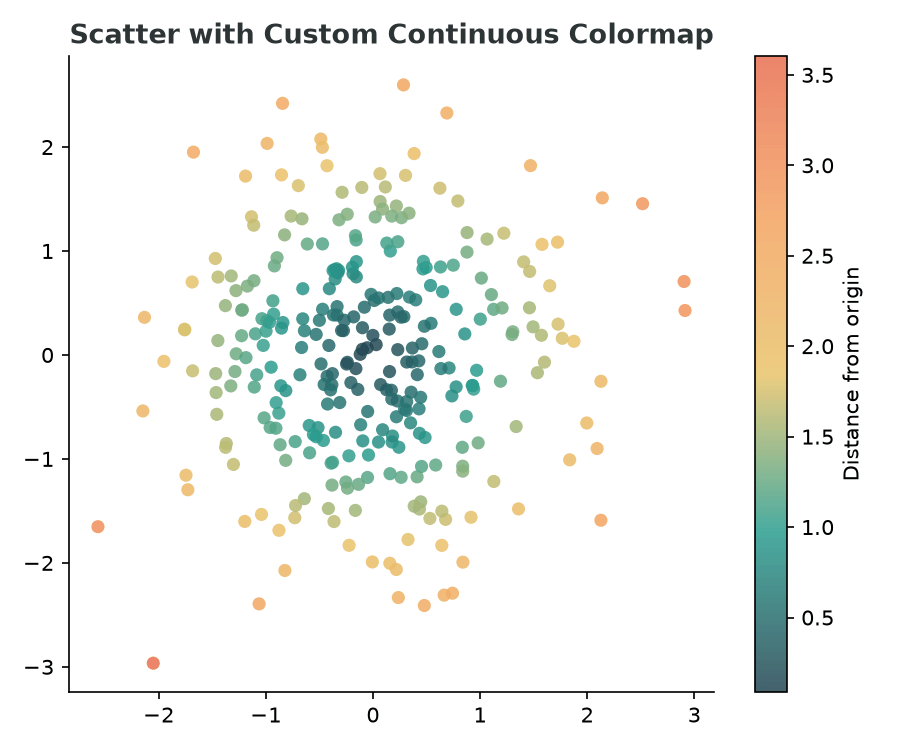
Create continuous and discrete custom colormaps in Matplotlib from a list of hex colors and apply them to scatter plots and heatmaps.
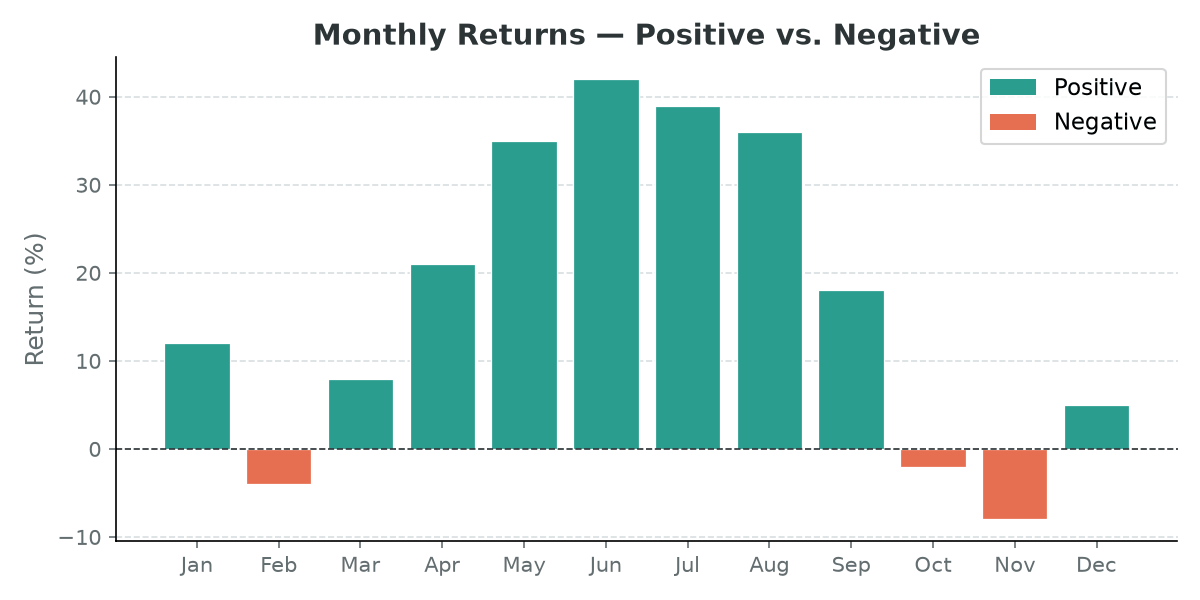
Color each bar in a Matplotlib bar chart individually — by threshold, colormap gradient, or to highlight a specific value.