
TL;DR
from matplotlib.colors import LinearSegmentedColormap

cmap = LinearSegmentedColormap.from_list(
    'brand',
    ['#264653', '#2A9D8F', '#E9C46A', '#F4A261', '#E76F51'],
)

ax.scatter(x, y, c=z, cmap=cmap)
Two ways to build a custom colormap
Matplotlib provides two classes for this:
| Class | Use case |
|---|---|
LinearSegmentedColormap |
Smooth gradient between colors — for continuous data |
ListedColormap |
Fixed discrete colors — for categorical data |
Continuous colormap with LinearSegmentedColormap
from_list() interpolates smoothly between any number of hex codes or RGB tuples you provide:
from matplotlib.colors import LinearSegmentedColormap

cmap = LinearSegmentedColormap.from_list(
    'brand',                                           # name (arbitrary)
    ['#264653', '#2A9D8F', '#E9C46A', '#F4A261', '#E76F51'],
)

You can also control where each color sits along the 0–1 range with a list of (position, color) tuples:
cmap = LinearSegmentedColormap.from_list(
    'skewed',
    [(0.0, '#264653'), (0.2, '#2A9D8F'), (1.0, '#E76F51')],
)
Discrete colormap with ListedColormap
When you want exactly N distinct colors — useful for categorical heatmaps or choropleth maps:
from matplotlib.colors import ListedColormap

discrete_cmap = ListedColormap(
    ['#264653', '#2A9D8F', '#E9C46A', '#F4A261', '#E76F51']
)

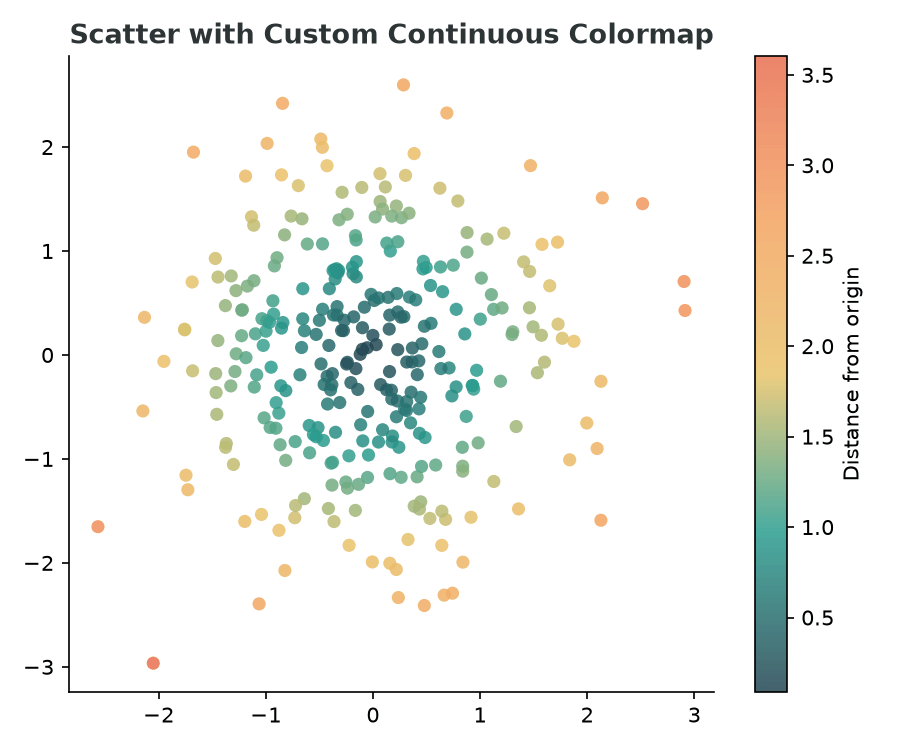
Using the colormap in a scatter plot
Pass it to the cmap argument alongside c (the values that drive the color):
import matplotlib.pyplot as plt
import numpy as np
from matplotlib.colors import LinearSegmentedColormap

rng = np.random.default_rng(42)
x = rng.standard_normal(300)
y = rng.standard_normal(300)
z = np.sqrt(x**2 + y**2)   # distance from origin

brand_cmap = LinearSegmentedColormap.from_list(
    'brand',
    ['#264653', '#2A9D8F', '#E9C46A', '#F4A261', '#E76F51'],
)

fig, ax = plt.subplots(figsize=(6, 5))
sc = ax.scatter(x, y, c=z, cmap=brand_cmap, s=40, edgecolors='none', alpha=0.85)
plt.colorbar(sc, ax=ax, label='Distance from origin')
plt.tight_layout()
plt.show()
Using the colormap in a heatmap
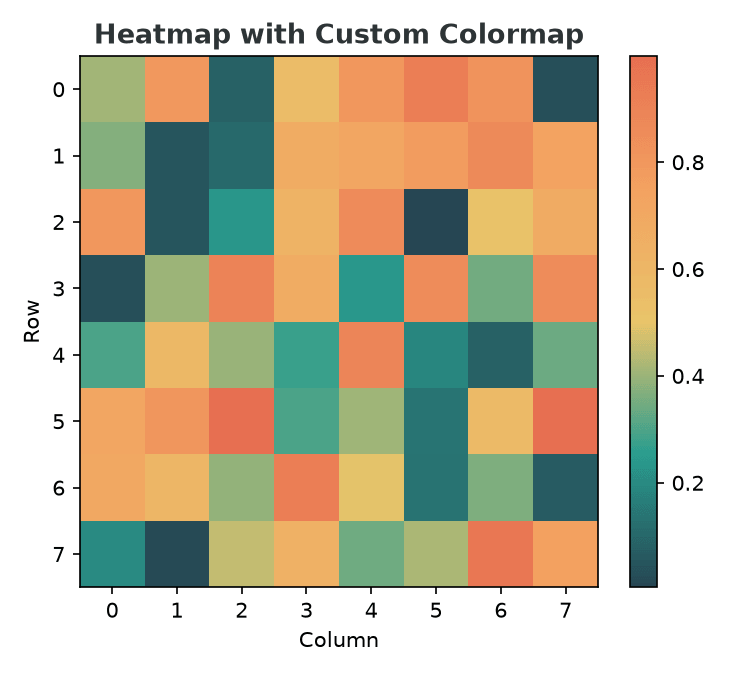
imshow and pcolormesh both accept cmap:
data = rng.uniform(0, 1, (8, 8))

fig, ax = plt.subplots(figsize=(5, 4.5))
im = ax.imshow(data, cmap=brand_cmap, aspect='auto')
plt.colorbar(im, ax=ax)
plt.show()
Registering a colormap globally
If you use the same custom colormap across many charts, register it once and refer to it by name:
import matplotlib as mpl

mpl.colormaps.register(brand_cmap, name='brand')

# Later, anywhere in the same session
ax.scatter(x, y, c=z, cmap='brand')
Reversing a colormap
Append _r to any registered name, or call .reversed() on the object:
cmap_r = brand_cmap.reversed()          # object
ax.imshow(data, cmap='brand_r')          # by name, once registered