
Matplotlib
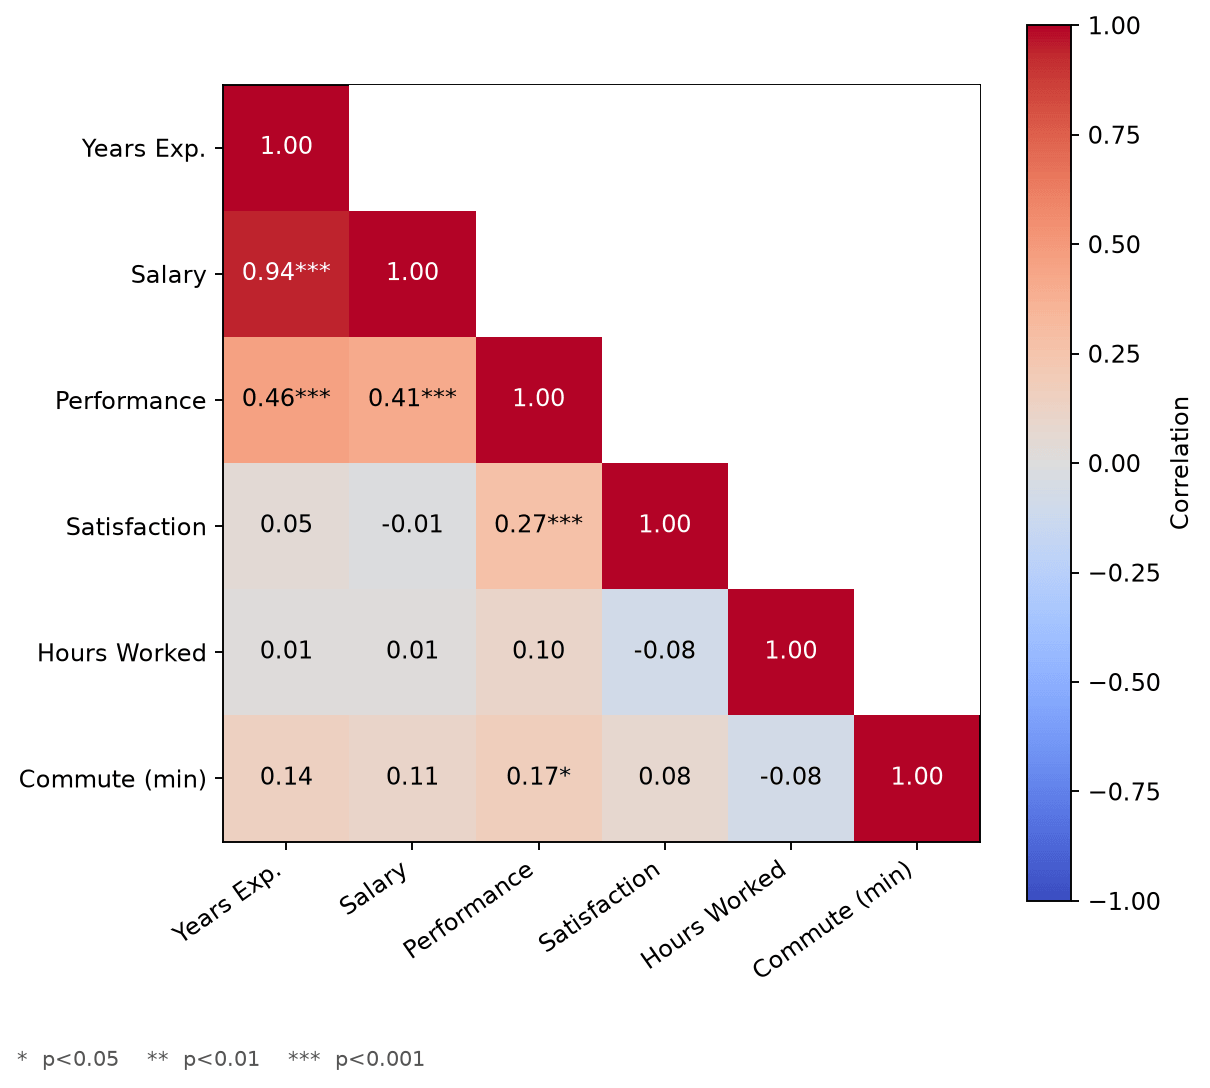
Plotting a Correlation Matrix Heatmap with Annotations
Build a correlation matrix heatmap in Matplotlib with rich annotations, including significance stars and a properly zero-centered color scale.
Build a correlation matrix heatmap in Matplotlib with rich annotations, including significance stars and a properly zero-centered color scale.
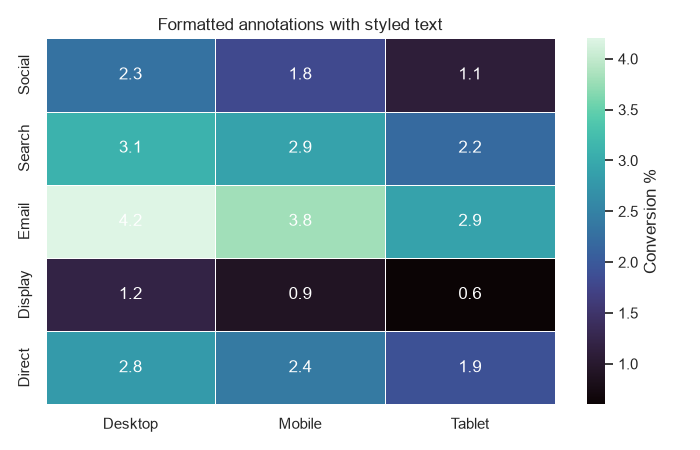
Style Seaborn heatmaps by annotating values, formatting labels, and masking cells you want to hide.
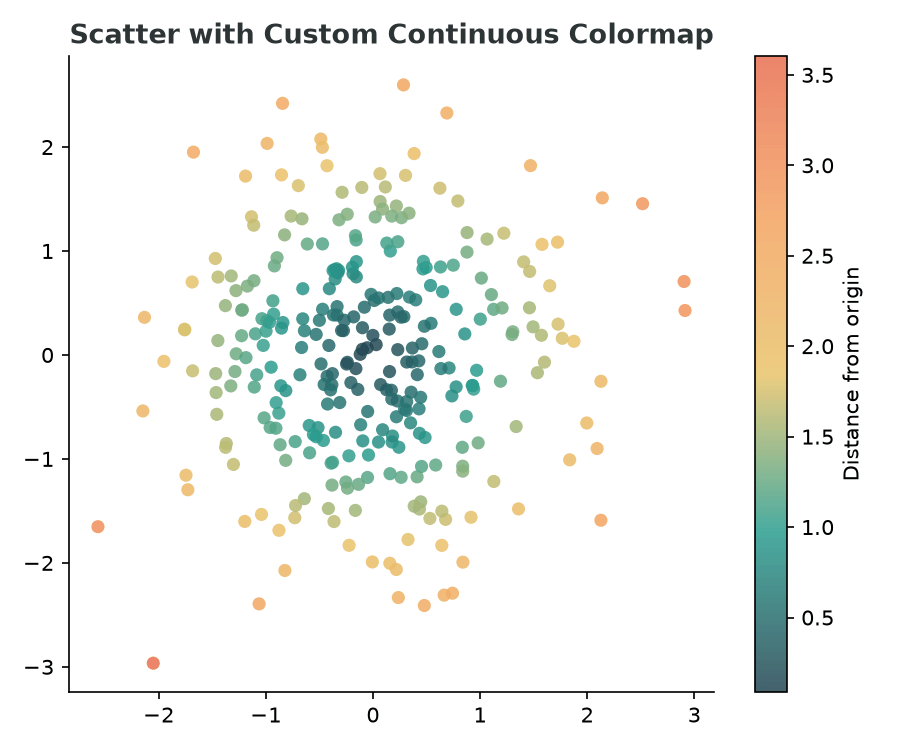
Create continuous and discrete custom colormaps in Matplotlib from a list of hex colors and apply them to scatter plots and heatmaps.
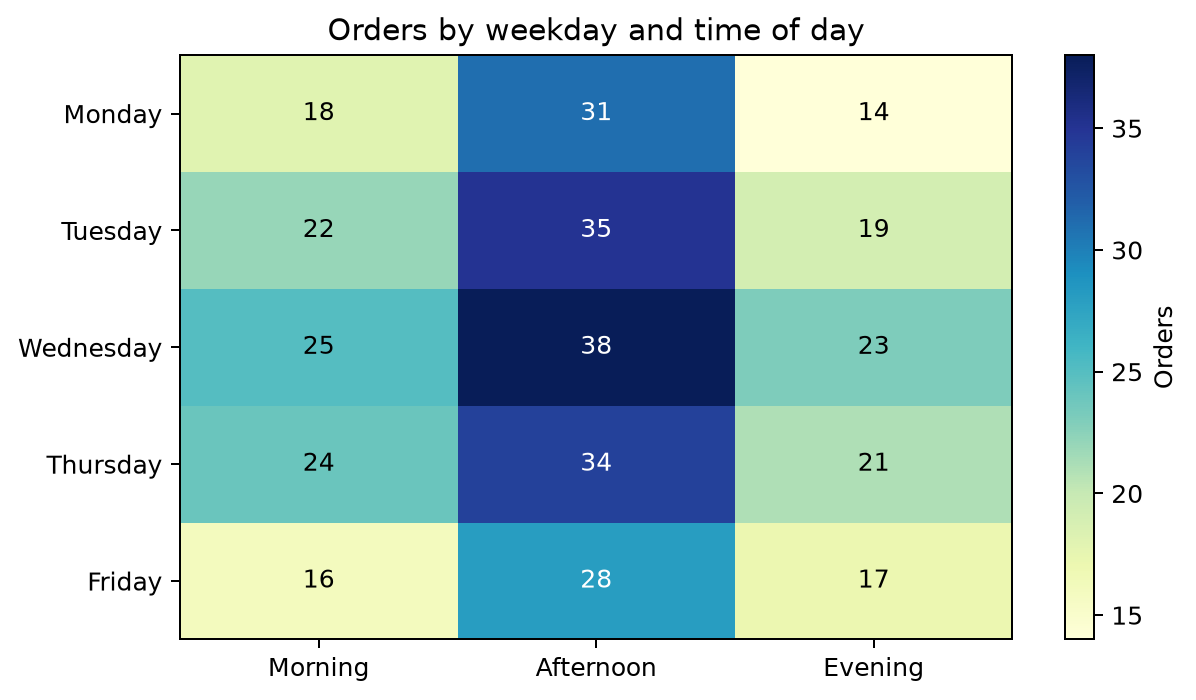
Create and customize heatmaps directly in Matplotlib with imshow() and pcolormesh().
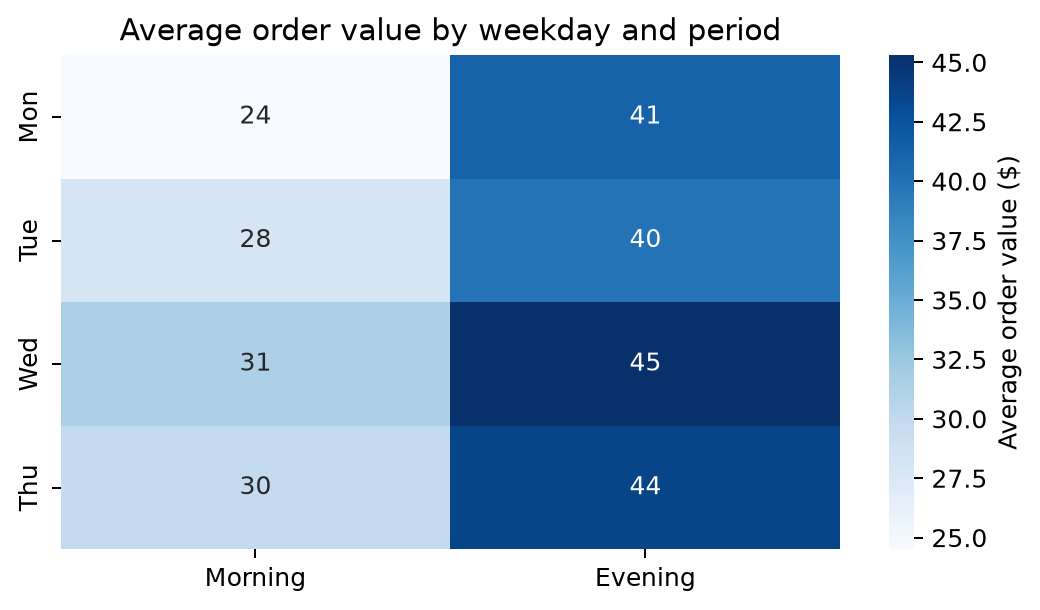
Build clear Seaborn heatmaps, from a simple matrix to annotated correlation charts.