
Pandas
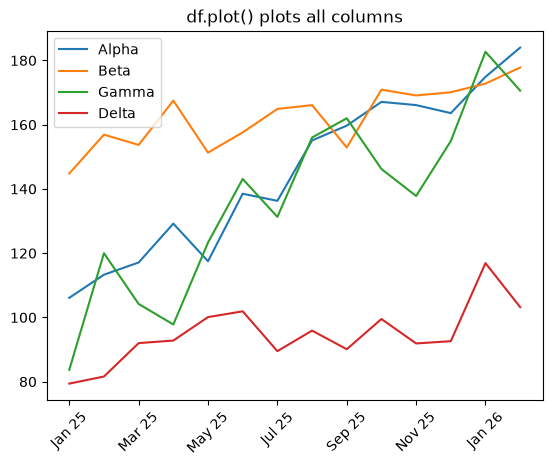
Plot Multiple Columns on the Same Line Chart in Pandas
Plot multiple DataFrame columns on one line chart in Pandas with df.plot and per-column colors and styles.
Plot multiple DataFrame columns on one line chart in Pandas with df.plot and per-column colors and styles.
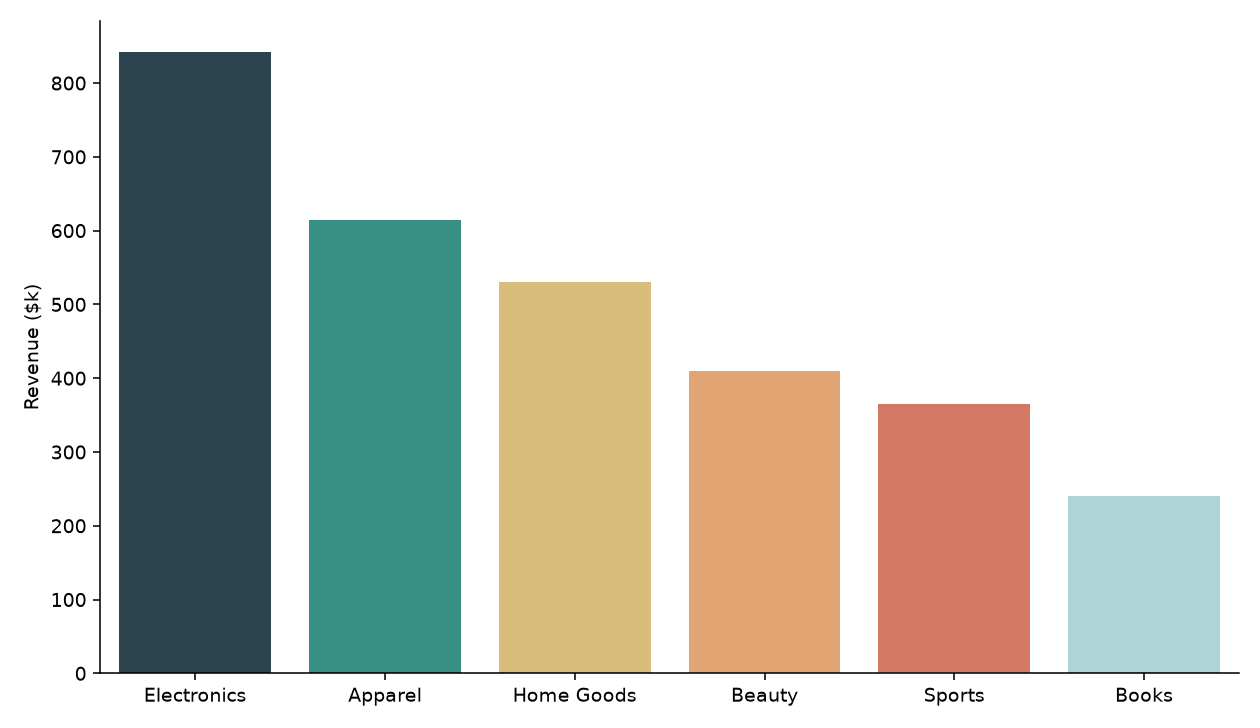
Set custom color palettes in Seaborn using hex lists, named palettes, category-to-color dictionaries, and diverging palettes.
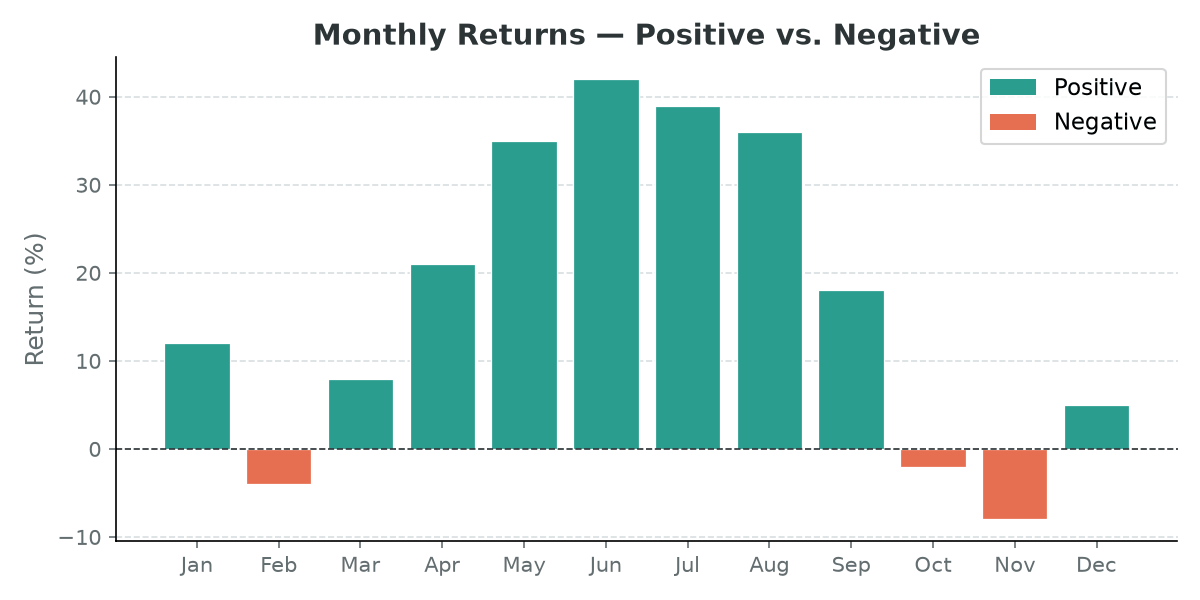
Color each bar in a Matplotlib bar chart individually — by threshold, colormap gradient, or to highlight a specific value.
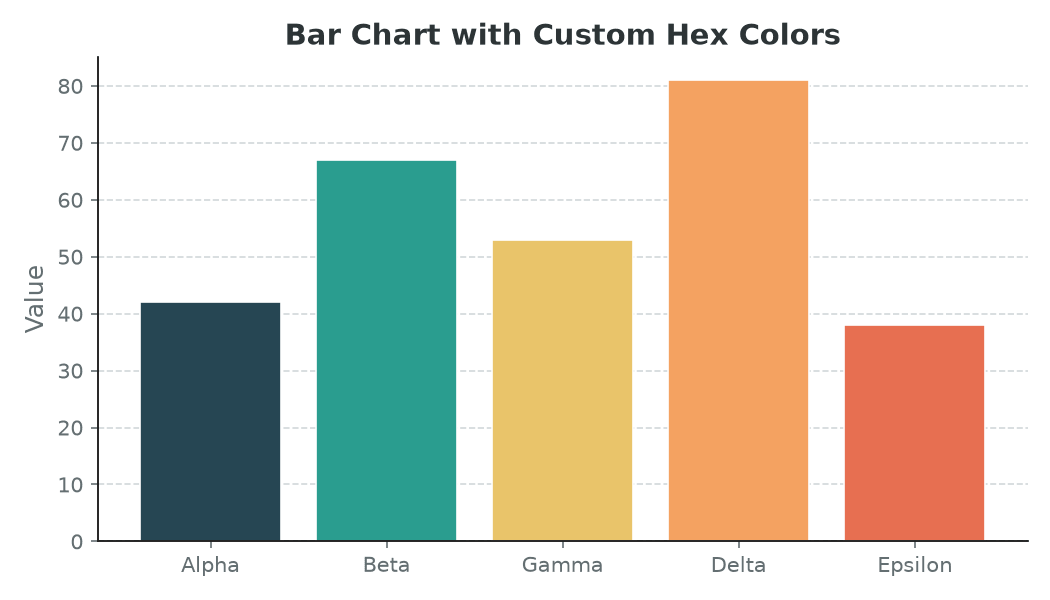
How to use hex color codes and custom RGB tuples to give Matplotlib charts a polished, on-brand look.

Setting colors, color cycles, and colormaps in Matplotlib