
Pandas
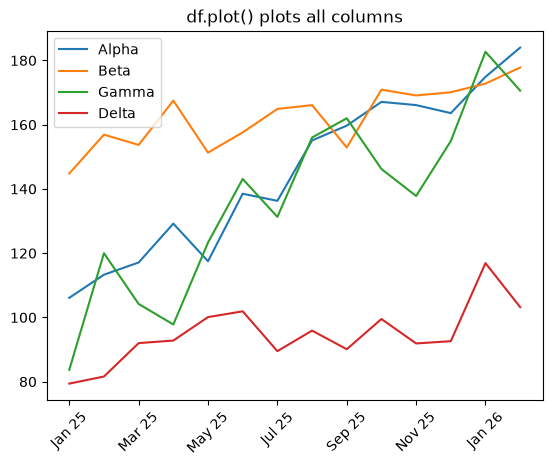
Plot Multiple Columns on the Same Line Chart in Pandas
Plot multiple DataFrame columns on one line chart in Pandas with df.plot and per-column colors and styles.
Plot multiple DataFrame columns on one line chart in Pandas with df.plot and per-column colors and styles.
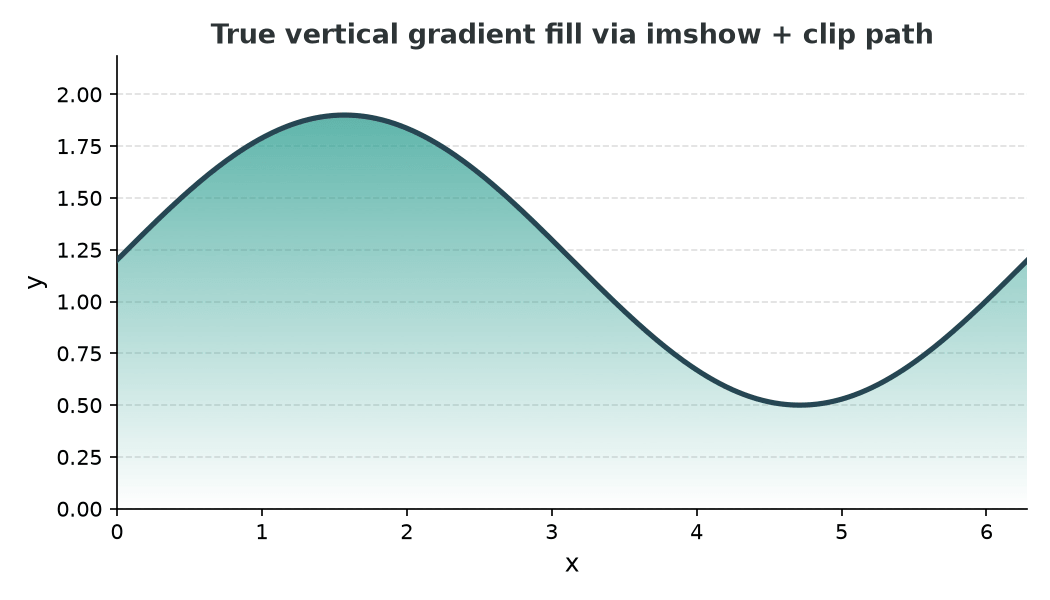
Add shaded areas and true vertical gradient fills under Matplotlib line plots using fill_between and imshow with a clip path.