
Matplotlib plots fit inside desktop GUIs through backend-specific canvas widgets. The same figure object you plot with can be placed into a Tkinter or PyQt window, so your app shows live charts alongside buttons, sliders, and labels.
Quick Example
Create the figure as usual, then wrap it in a canvas and pack it into the window.
import tkinter as tk
from matplotlib.backends.backend_tkagg import FigureCanvasTkAgg

root = tk.Tk()
canvas = FigureCanvasTkAgg(fig, master=root)   # embed fig
canvas.draw()
canvas.get_tk_widget().pack(fill="both", expand=True)
root.mainloop()
For PyQt, import the matching canvas class and hand it the figure:
from matplotlib.backends.backend_qtagg import FigureCanvasQTAgg
Either way the rule is the same: make a fig, wrap it in a canvas, and add the canvas to your window.
Why embed a figure
An embedded canvas turns a static chart into the centerpiece of a real application. You can pair the plot with widgets that redraw it: a dropdown that changes the data, a slider that adjusts a parameter, or a button that refreshes the view. The chart stays a normal matplotlib figure, so all of matplotlib's plotting API works on it.
Tkinter with FigureCanvasTkAgg
Tkinter is bundled with Python, so it is the fastest path. Build a Tk root, create a FigureCanvasTkAgg around your figure, and place it in the window.
import tkinter as tk
import matplotlib.pyplot as plt
from matplotlib.backends.backend_tkagg import FigureCanvasTkAgg

fig, ax = plt.subplots(figsize=(6, 3.5))
ax.plot(dates, values)
fig.autofmt_xdate()

root = tk.Tk()
root.title("Matplotlib in Tkinter")
root.geometry("760x480")

canvas = FigureCanvasTkAgg(fig, master=root)
canvas.draw()
canvas.get_tk_widget().pack(side="top", fill="both", expand=True)

label = tk.Label(root, text="Reports rendered from data", relief="raised")
label.pack(side="bottom", fill="x")

root.mainloop()
This post doesn't include a live screenshot of the desktop window, because grabbing a specific Tk window from a headless script is unreliable. The figure that appears inside that window is the same standalone chart shown in the next section.
canvas.get_tk_widget() returns the Tkinter widget holding the plot, which you place with pack or grid like any other Tkinter control. Because Tkinter ships with Python, this example needs no extra install beyond matplotlib.
The figure on its own
The embedded chart is a normal matplotlib figure, so it renders identically whether it is on its own or packed into the window.
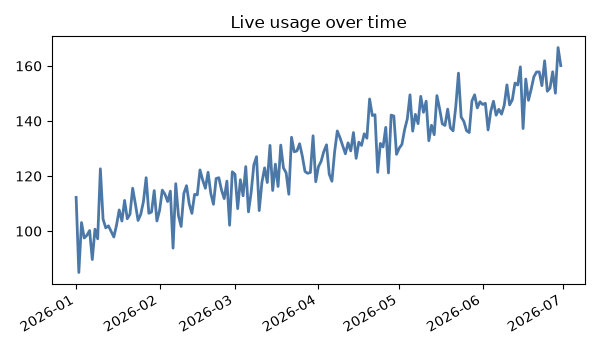
Keep the figure a reasonable size (figsize) and call canvas.draw() so the canvas reflects the latest version of the figure.
PyQt with FigureCanvasQTAgg
PyQt applications embed the same figure through FigureCanvasQTAgg. Install a PyQt binding (for example PyQt6 or PySide6), then set up a QMainWindow with the canvas as its central widget.
from PyQt6.QtWidgets import QMainWindow, QApplication
from matplotlib.backends.backend_qtagg import FigureCanvasQTAgg
from matplotlib.backends.backend_qtagg import NavigationToolbar2QT
import sys

class MainWindow(QMainWindow):
    def __init__(self):
        super().__init__()
        canvas = FigureCanvasQTAgg(fig)
        toolbar = NavigationToolbar2QT(canvas, self)
        self.setCentralWidget(canvas)
        self.addToolBar(toolbar)

app = QApplication(sys.argv)
window = MainWindow()
window.show()
app.exec()
The PyQt canvas adds a built-in navigation toolbar for zoom and pan, which Tkinter does not include by default. The chart PNG earlier shows what that figure looks like inside the window.
Redraw from widgets
To make the chart interactive with your own controls, update the figure and tell the canvas to redraw.
ax.clear()
ax.plot(new_x, new_y)
canvas.draw()   # Tkinter / PyQt
Calling canvas.draw() after changing the axes repaints the embedded chart. Connect a button or a slider to a function that does this, and the plot reacts to user input.
Practical Tips
- Create the matplotlib
figfirst, then wrap it in the backend canvas. - Use
FigureCanvasTkAggfor Tkinter andFigureCanvasQTAggfor PyQt. - Call
canvas.draw()whenever you update the axes so the window refreshes. - Place the canvas with
pack/grid(Tkinter) or as the central widget (PyQt). - Size the figure with
figsizeso it fits the window without clipping.