The Two Matplotlib Interfaces
When you start using Matplotlib, you'll often see two different ways of creating plots. One is by calling functions directly from matplotlib.pyplot (commonly imported as plt), and the other is by creating a figure and one or more axes objects and calling methods on them.
The plt (Pyplot) Interface
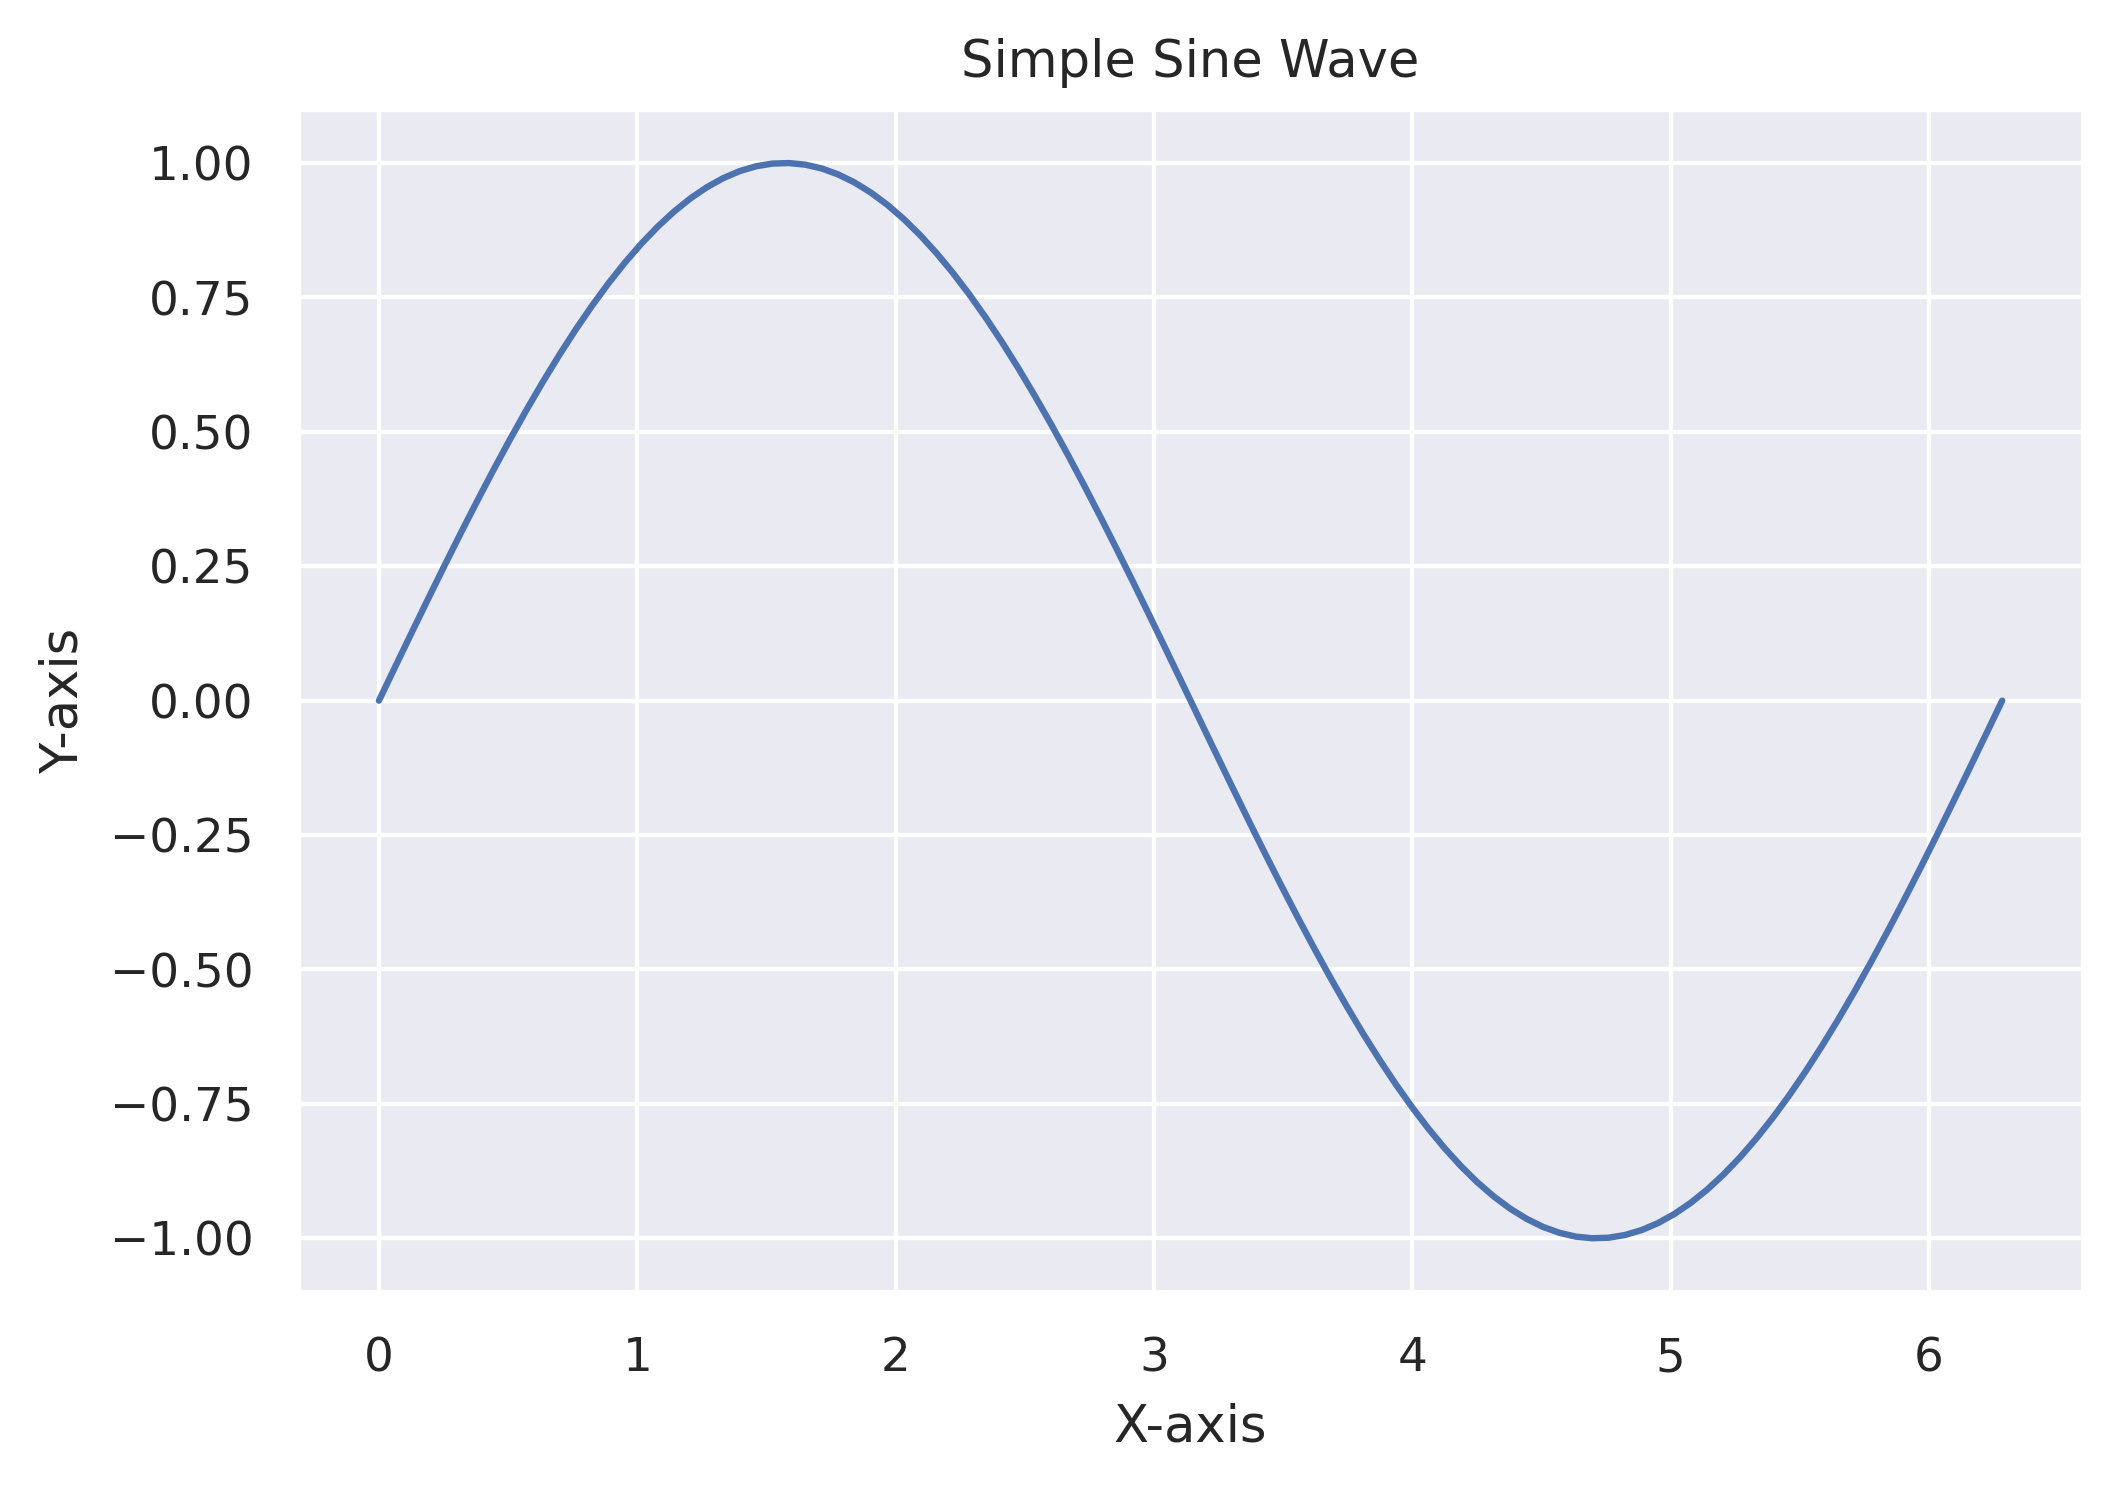
For simple plots, using plt directly is quick and easy. It automatically handles creating the figure and axes for you behind the scenes.
import matplotlib.pyplot as plt
import numpy as np

x = np.linspace(0, 2 * np.pi, 100)
y = np.sin(x)

plt.figure()
plt.plot(x, y)
plt.xlabel("X-axis")
plt.ylabel("Y-axis")
plt.title("Simple Sine Wave")
plt.show()
This is great for quick explorations, but it can become cumbersome when you want to create more complex figures with multiple plots.
The Figure and Axes Interface with plt.subplots()
A more powerful and flexible way to create plots is to explicitly create a Figure and one or more Axes objects. The plt.subplots() function is the most common way to do this.
It returns a Figure object and an array of Axes objects. When creating a single plot, it's conventional to use fig, ax = plt.subplots().
# Data for the plots
x = np.linspace(0, 2 * np.pi, 100)
y = np.sin(x)

# Create a figure and a single axes
fig, ax = plt.subplots()

ax.plot(x, y)
ax.set_xlabel("X-axis")
ax.set_ylabel("Y-axis")
ax.set_title("Sine Wave using Axes object")
plt.show()

Notice that the plotting functions are now methods of the ax object (e.g., ax.plot() instead of plt.plot(), and ax.set_xlabel() instead of plt.xlabel()). This object-oriented approach is more explicit and gives you finer control over your plots.
Creating Multiple Subplots
The real power of plt.subplots() comes from its ability to create a grid of plots. You just need to tell it how many rows and columns you want.
Let's create a 2x2 grid of plots.
# Create a 2x2 grid of subplots
fig, axs = plt.subplots(2, 2, figsize=(10, 8))

# Data for the plots
x = np.linspace(0, 2 * np.pi, 100)
y1 = np.sin(x)
y2 = np.cos(x)
y3 = np.tan(x)
y4 = np.sinc(x)

# Top-left plot
axs[0, 0].plot(x, y1)
axs[0, 0].set_title('Sine')

# Top-right plot
axs[0, 1].plot(x, y2)
axs[0, 1].set_title('Cosine')

# Bottom-left plot
axs[1, 0].plot(x, y3)
axs[1, 0].set_title('Tangent')
axs[1, 0].set_ylim(-5, 5) # Limit y-axis for tangent

# Bottom-right plot
axs[1, 1].plot(x, y4)
axs[1, 1].set_title('Sinc')

# Add a title for the entire figure
fig.suptitle('Various Waveforms', fontsize=16)
plt.show()

In this example, axs is a 2D NumPy array containing the four Axes objects. We can access each one using standard array indexing (axs[0, 0], axs[0, 1], etc.) to create each plot.
Using plt.subplots() is the recommended approach for creating anything beyond a simple, single plot in Matplotlib. It provides a clear, explicit, and powerful way to manage complex figures.