
Animations are a great way to show change over time without forcing readers to mentally connect a long series of still plots. In Matplotlib, the workflow is straightforward once you think in terms of a function that updates the chart one frame at a time.
The most common pattern is to use FuncAnimation, then save that animation as a GIF or MP4 file. This is useful for dashboards, presentations, and blog posts where a short loop adds a lot of clarity.
Quick Example
import numpy as np
import matplotlib.pyplot as plt
from matplotlib.animation import FuncAnimation, PillowWriter

x = np.linspace(0, 2 * np.pi, 200)

fig, ax = plt.subplots(figsize=(8, 5))
line, = ax.plot(x, np.sin(x), lw=2, color='steelblue')
ax.set_xlim(0, 2 * np.pi)
ax.set_ylim(-1.2, 1.2)
ax.set_xlabel('x')
ax.set_ylabel('sin(x)')
ax.set_title('Animated sine wave')


def update(frame):
    line.set_ydata(np.sin(x + frame / 10))
    return line,


ani = FuncAnimation(fig, update, frames=90, interval=30, blit=True)
ani.save('animated-sine.gif', writer=PillowWriter(fps=30))
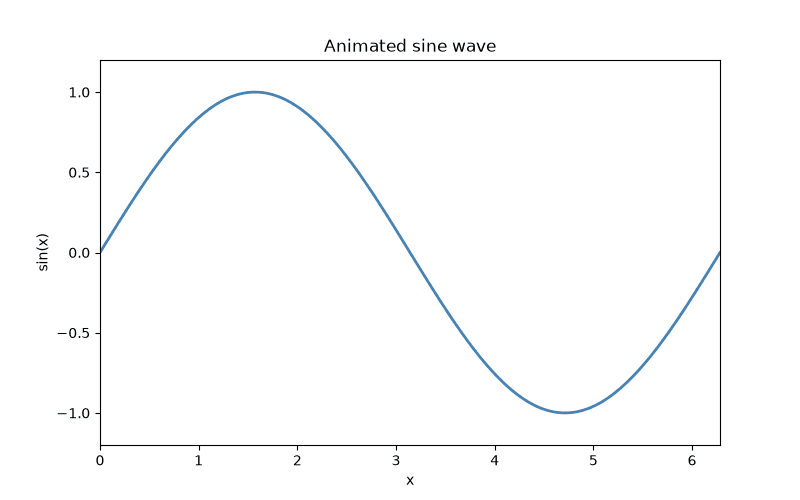
This creates a compact animation loop where the phase of the sine wave changes frame by frame. That is the core pattern behind most Matplotlib animations.
The basic animation pattern
The key idea is to define a function that updates the plotted objects on every frame. In practice, that usually means updating a line, scatter points, bars, or a marker position.
import numpy as np
import matplotlib.pyplot as plt
from matplotlib.animation import FuncAnimation

x = np.linspace(0, 2 * np.pi, 200)
fig, ax = plt.subplots()
line, = ax.plot(x, np.sin(x))


def update(frame):
    line.set_ydata(np.sin(x + frame / 20))
    return line,


ani = FuncAnimation(fig, update, frames=100, interval=20, blit=True)
A few details matter here:
framescontrols how many times the update function runs.intervalsets the delay in milliseconds between frames.blit=Truecan improve animation performance when your plot is not too complex.
Save as a GIF
To save an animation as a GIF, use PillowWriter. This is usually the easiest route if you want a lightweight, browser-friendly output.
from matplotlib.animation import PillowWriter

ani.save('animated-sine.gif', writer=PillowWriter(fps=30))
This only requires the Pillow dependency that Matplotlib already uses for image output. It is a good default choice when you want a quick animated file for a blog or a presentation.
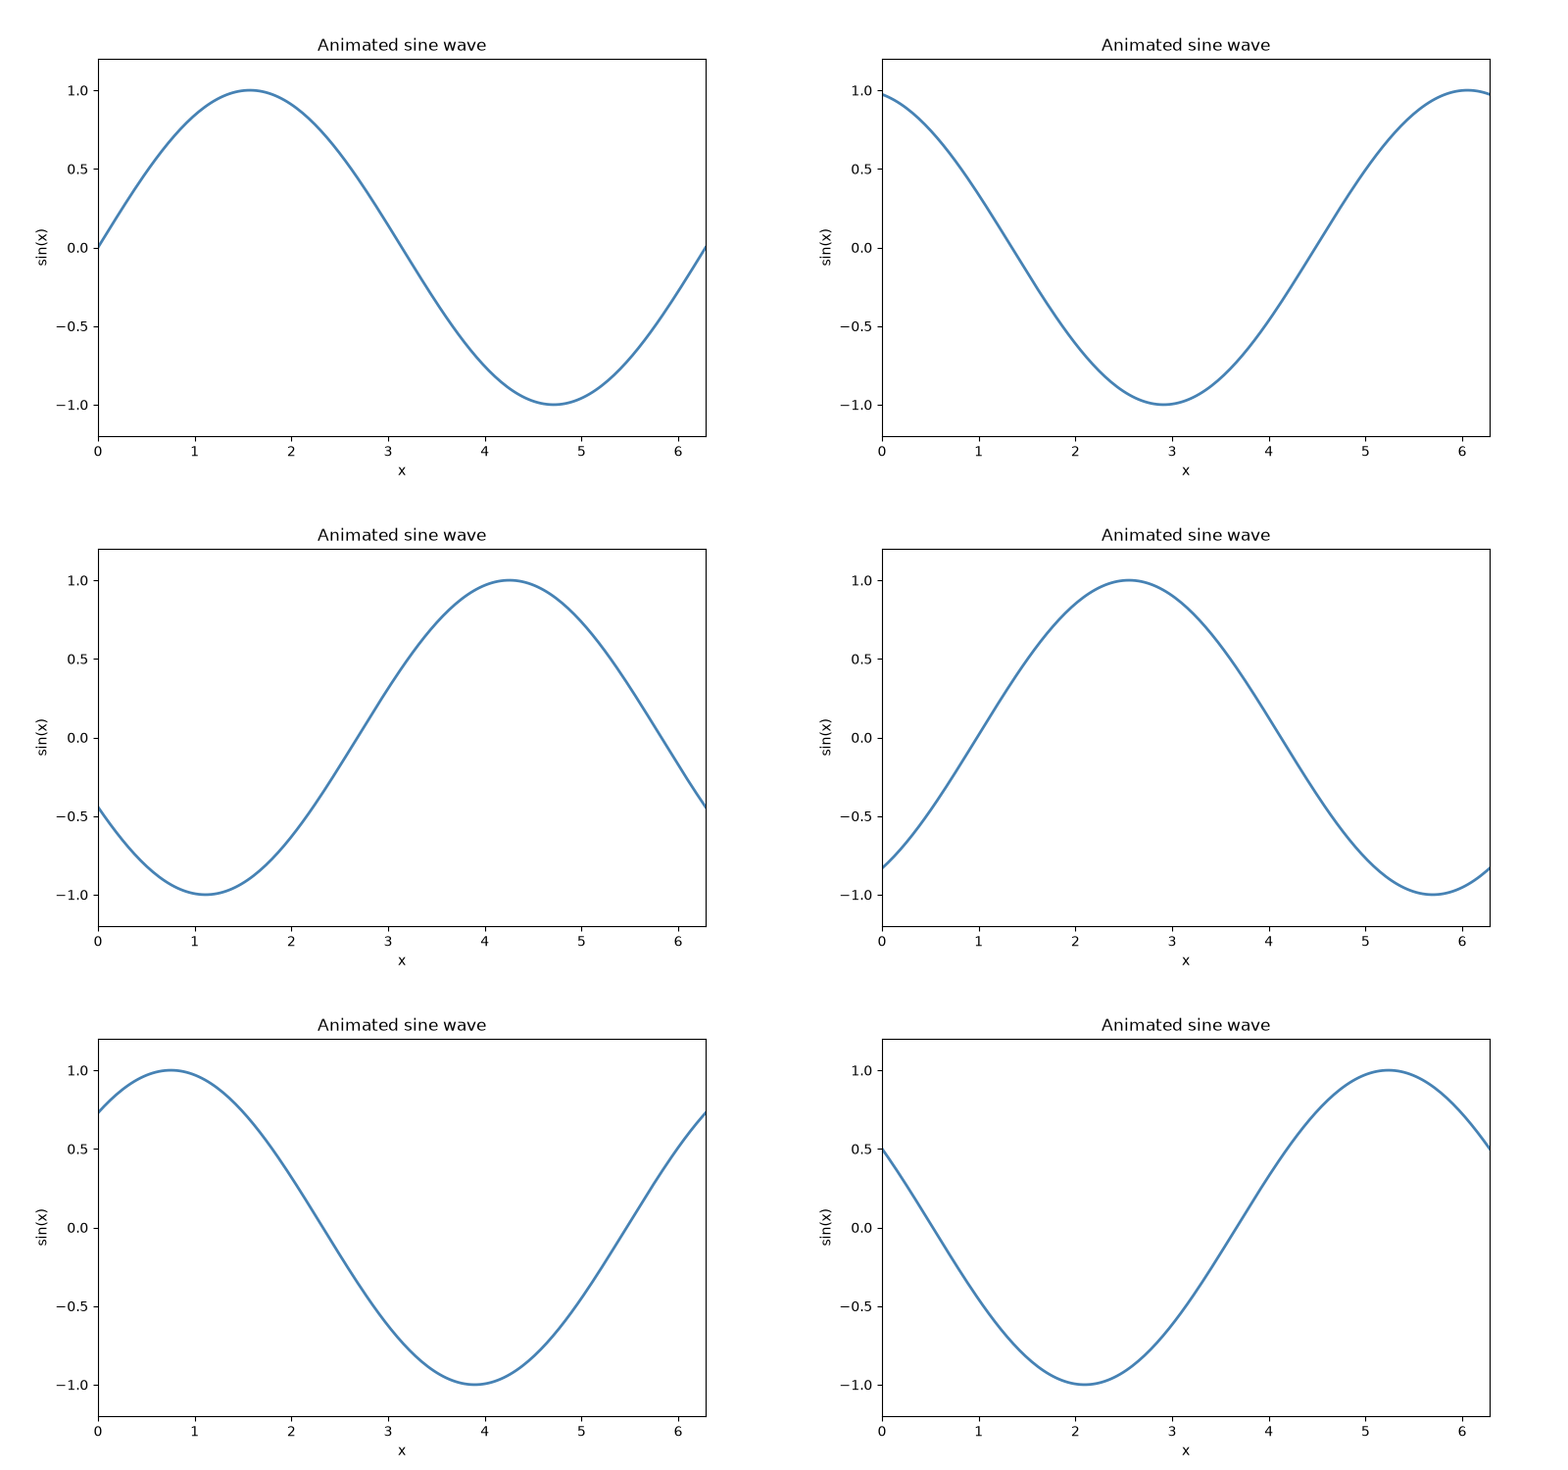
GIF example:
Save as an MP4
If you want a video file instead, save the animation with the FFmpeg writer. This requires a working ffmpeg installation on your machine.
ani.save('animated-sine.mp4', writer='ffmpeg', fps=30)
If Matplotlib cannot find ffmpeg, you will usually get a clear error telling you the writer is missing. On many systems, installing ffmpeg through a package manager solves that quickly.
MP4 example:
A slightly more realistic example
A common use case is animating a line that moves across time. Here is a small example with a moving dot and a line trace.
import matplotlib.pyplot as plt
import numpy as np
from matplotlib.animation import FuncAnimation

n = 200
x = np.linspace(0, 10, n)
y = np.sin(x)

fig, ax = plt.subplots(figsize=(8, 5))
(line,) = ax.plot(x, y, color="royalblue", lw=2)
(point,) = ax.plot([], [], "o", color="tomato", markersize=8)

ax.set_xlim(0, 10)
ax.set_ylim(-1.5, 1.5)
ax.set_title("Animated line and point")


def update(frame):
    idx = frame
    # Calculate the updated line y-values for this frame
    current_y = np.sin(x + frame / 15)

    # Update line values
    line.set_ydata(current_y)

    # Point tracks the moving y-value at index `idx`
    point.set_data([x[idx]], [current_y[idx]])

    return line, point


# Create and hold the animation instance
ani = FuncAnimation(fig, update, frames=n, interval=20, blit=True)

# Save the video
ani.save("animated-sine-point.mp4", writer="ffmpeg", fps=30)

# Clean up the figure explicitly to free memory
plt.close(fig)
This is the same idea as the simpler example, but it makes the animation more visually intuitive because the point tracks the line as it changes.
Animated MP4 example:
Saving a static preview image
If this is going into a blog or documentation, it helps to include a still preview alongside the animation. You can save the frame at any point like this:
fig.savefig('matplotlib-animation.png', dpi=200, bbox_inches='tight')
That gives you a PNG version for the article thumbnail while the GIF or MP4 handles the motion.
Practical tips
- Use
fps=24orfps=30for smooth playback. - Keep the animation short. A few seconds is often enough.
- Reduce the figure size when you are creating a GIF for the web.
- For large animations,
blit=Truecan reduce rendering cost. - If you need a video of a longer process,
ffmpegis usually the better output format.