
Python makes it easy to turn a set of charts into a shareable PDF. The simplest path needs only Matplotlib: make your figures, then collect them into a PDF with PdfPages. No extra libraries required.
Quick Example
Save a list of Matplotlib figures into a multi-page PDF in one with block.
from matplotlib.backends.backend_pdf import PdfPages

with PdfPages("report.pdf") as pdf:
    pdf.savefig(fig1)   # page 1
    pdf.savefig(fig2)   # page 2
Every savefig() call becomes one PDF page. Open the file after the block closes and you have a report made of your charts.
Create the charts
Start by building the figures you want in the report with normal Matplotlib calls. Keep them on separate Figure objects so each can become its own page.
import matplotlib.pyplot as plt

fig1, ax1 = plt.subplots(figsize=(9, 5))
ax1.plot(months, revenue, marker="o", lw=2)
ax1.set_title("Monthly revenue")

fig2, ax2 = plt.subplots(figsize=(9, 5))
ax2.bar(regions, region_sales)
ax2.set_title("Sales by region")
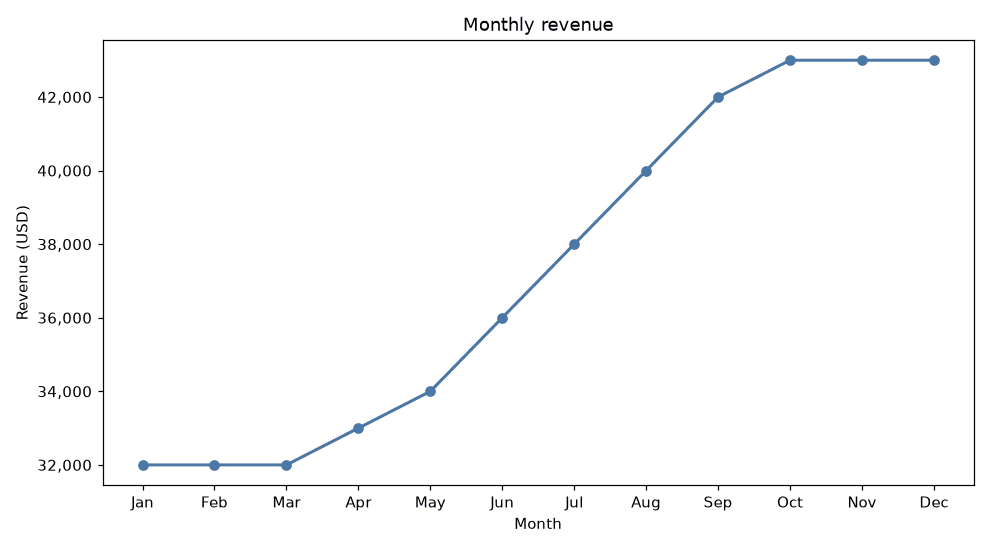
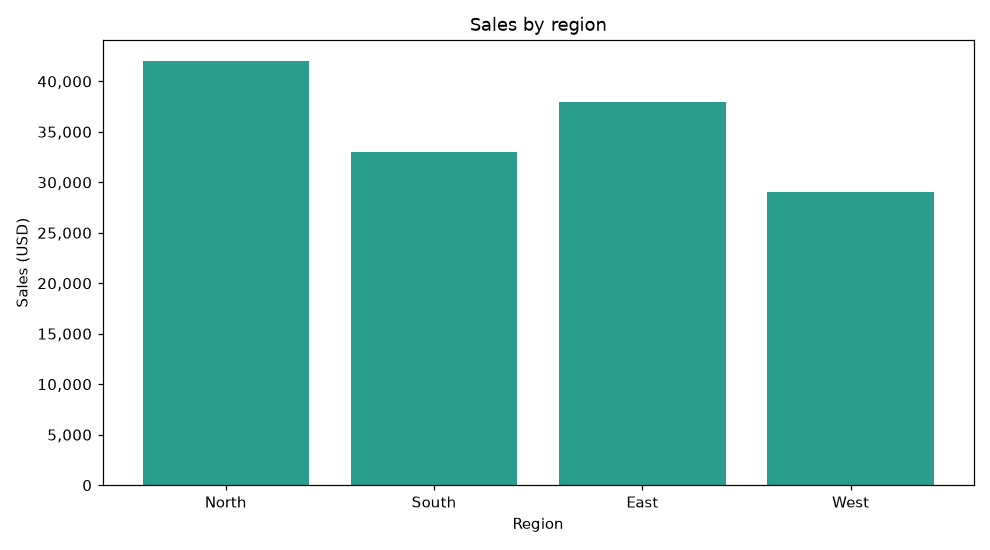
Give every figure a readable size and clear labels, since whatever you plot is exactly what ends up on the page.
Combine them into a PDF
PdfPages writes one page per savefig(), in the order you call them.
from matplotlib.backends.backend_pdf import PdfPages

with PdfPages("report.pdf") as pdf:
    pdf.savefig(fig1)   # revenue
    pdf.savefig(fig2)   # regional sales
You can build this loop over any number of figures, so the same code scales from a two-chart memo to a full dashboard.
Add a title page
A report usually starts with a title. Make a simple figure that holds text, and save it as the first page.
fig0 = plt.figure(figsize=(8.5, 11))
fig0.text(0.1, 0.72, "Monthly Sales Report", fontsize=30, weight="bold")
fig0.text(0.1, 0.66, "Prepared 2026-08-16", fontsize=14)
plt.axis("off")

with PdfPages("report.pdf") as pdf:
    pdf.savefig(fig0)   # cover
    pdf.savefig(fig1)
    pdf.savefig(fig2)
fig.text() places the headline on an empty figure, and axis("off") removes any axes so the page is just the text.
Share the result
The output is a normal PDF, so it uploads anywhere and opens in any viewer. For this post, here is the report the code above produces:
Download the sample PDF report
If you need laid-out text, tables, and headers around the charts, look at reportlab or weasyprint instead. Those let you run a chart to an image, embed it into a page of a styled document, and produce a much richer report. The Matplotlib-only route above is the fastest way to get charts into a PDF with zero extra setup.
Practical Tips
- Give every figure a title, labels, and a sensible size before saving, since it renders as-is.
- Use a
with PdfPages(...)block so the file is always closed properly. - Call
pdf.savefig(fig)once per desired page. - Make a text-only figure for a cover page when you want a title header.
- For full layouts with prose and tables, add
reportlaborweasyprintand embed the charts as images.