
Python
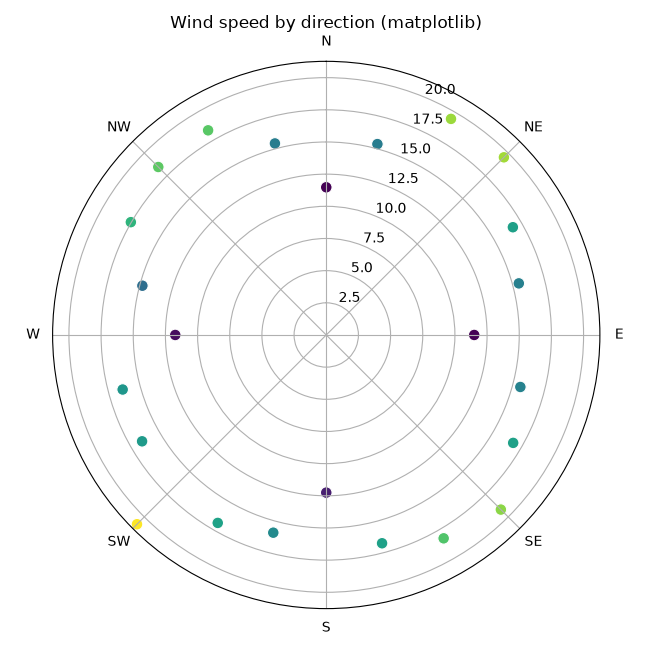
Creating Polar Scatter Plots in Matplotlib and Plotly
Create polar scatter plots in Matplotlib and Plotly to show points by angle and radius.
Create polar scatter plots in Matplotlib and Plotly to show points by angle and radius.
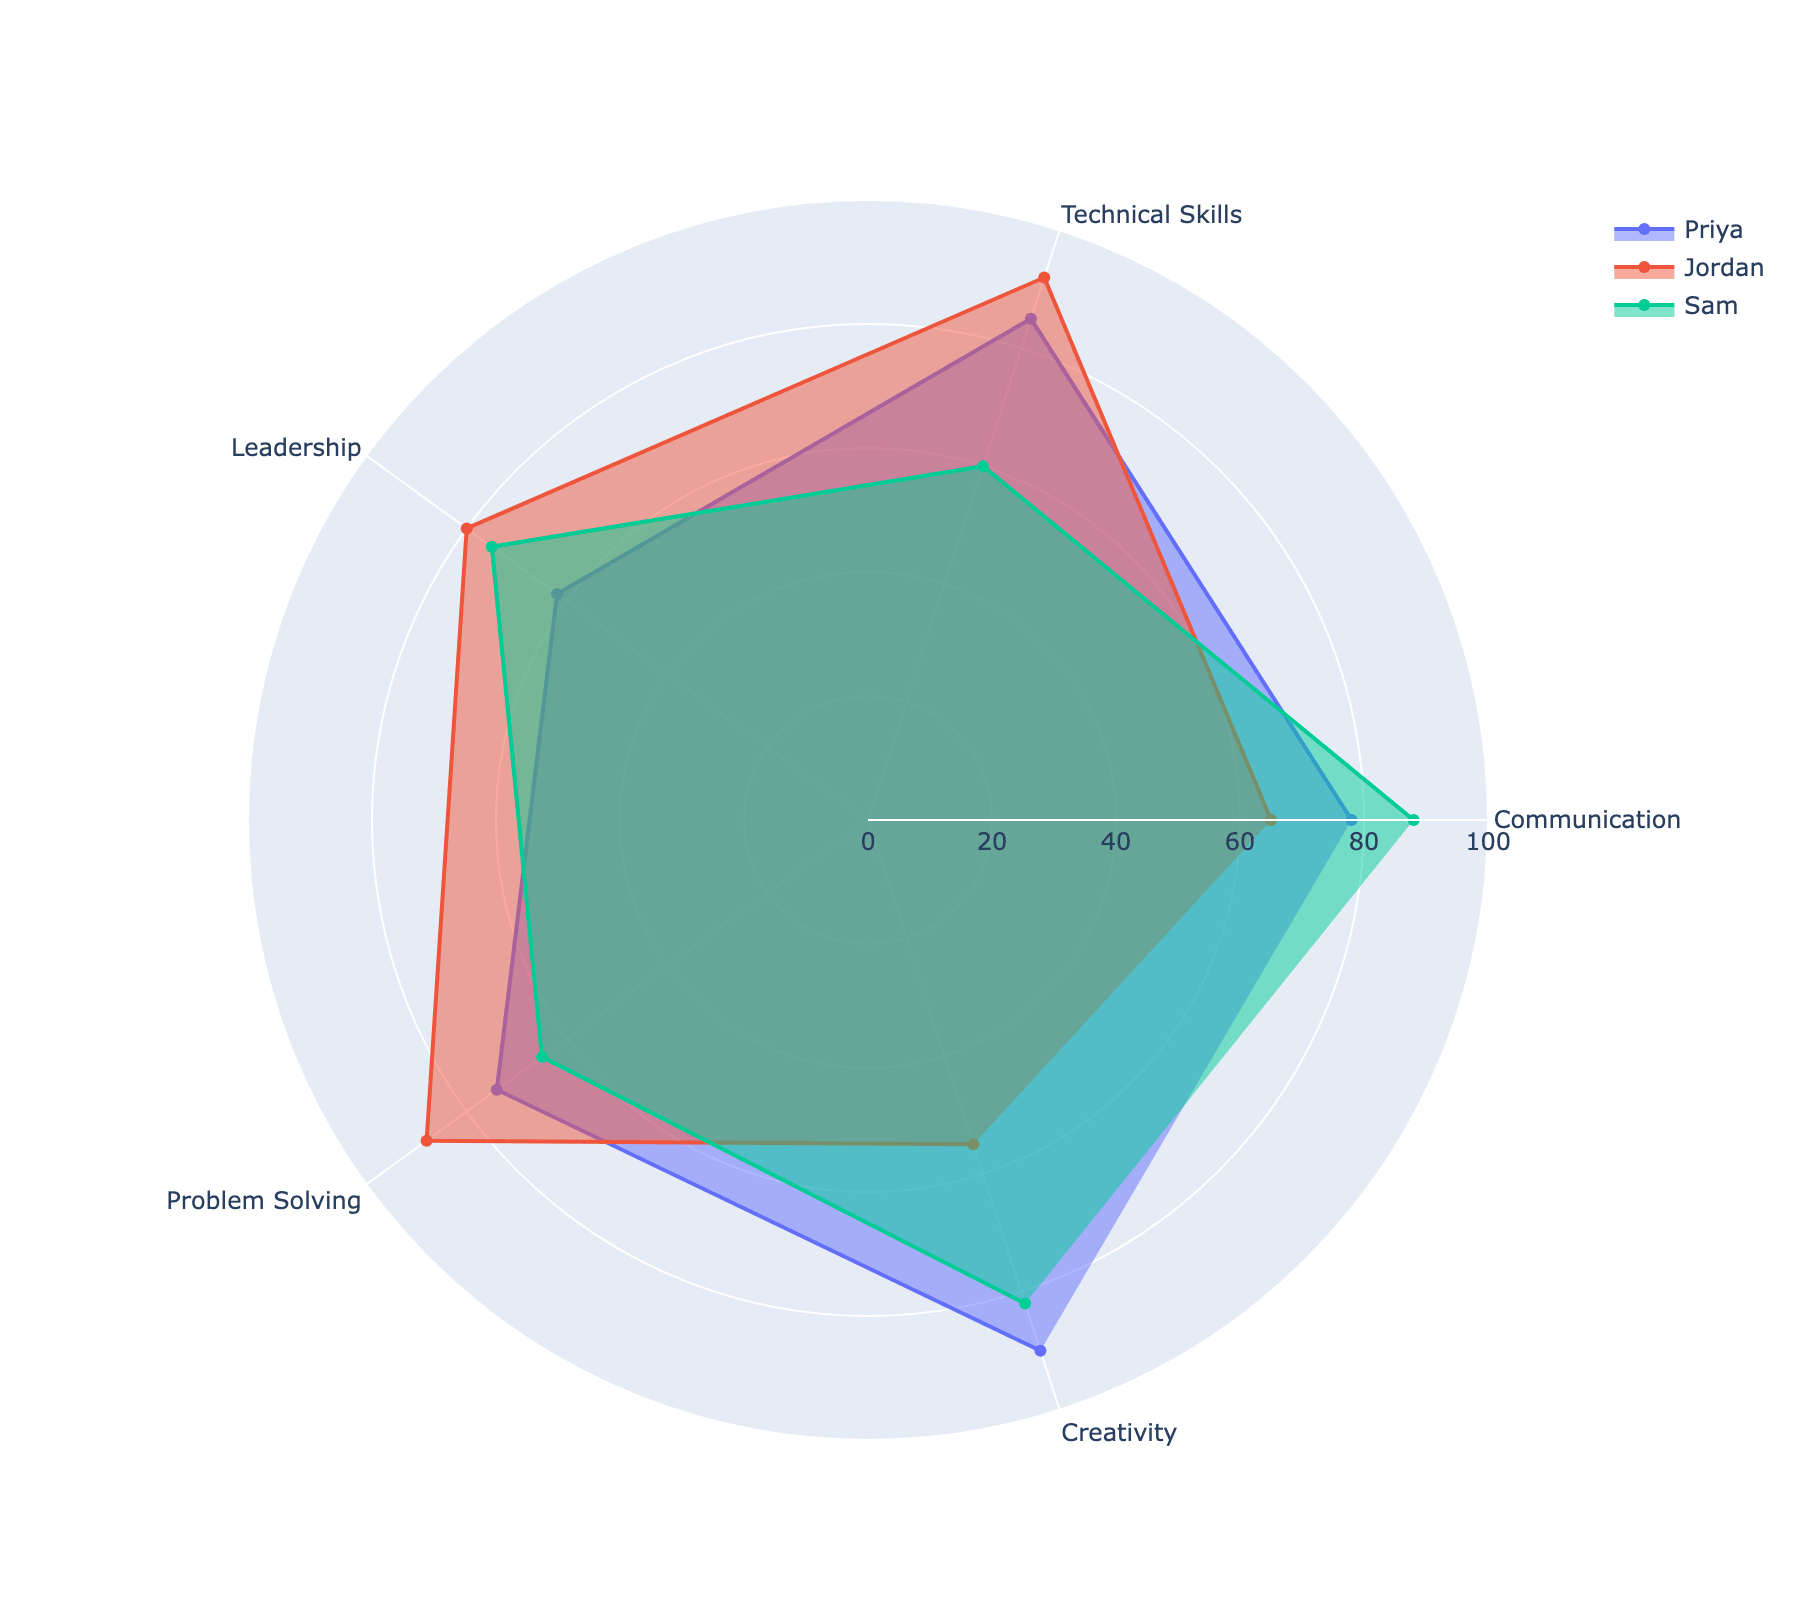
Build interactive radar (spider) charts in Plotly using go.Scatterpolar, including comparing multiple entities and customizing the radial axis.