
Every Matplotlib chart uses DejaVu Sans unless told otherwise, which is fine for quick exploratory plots but rarely matches a brand's actual typography. Swapping in a custom font, like one downloaded from Google Fonts, is a three-step process: get the font file, register it, tell Matplotlib to use it.
Quick Example
Download a font's .ttf file, register it with addfont(), then set it as the active font family.
import matplotlib.pyplot as plt
import matplotlib.font_manager as fm

font_path = "PlayfairDisplay-Bold.ttf"  # downloaded from fonts.google.com
fm.fontManager.addfont(font_path)

font_name = fm.FontProperties(fname=font_path).get_name()
plt.rcParams["font.family"] = font_name

fig, ax = plt.subplots()
ax.bar(months, revenue)
ax.set_title("Custom Brand Font")
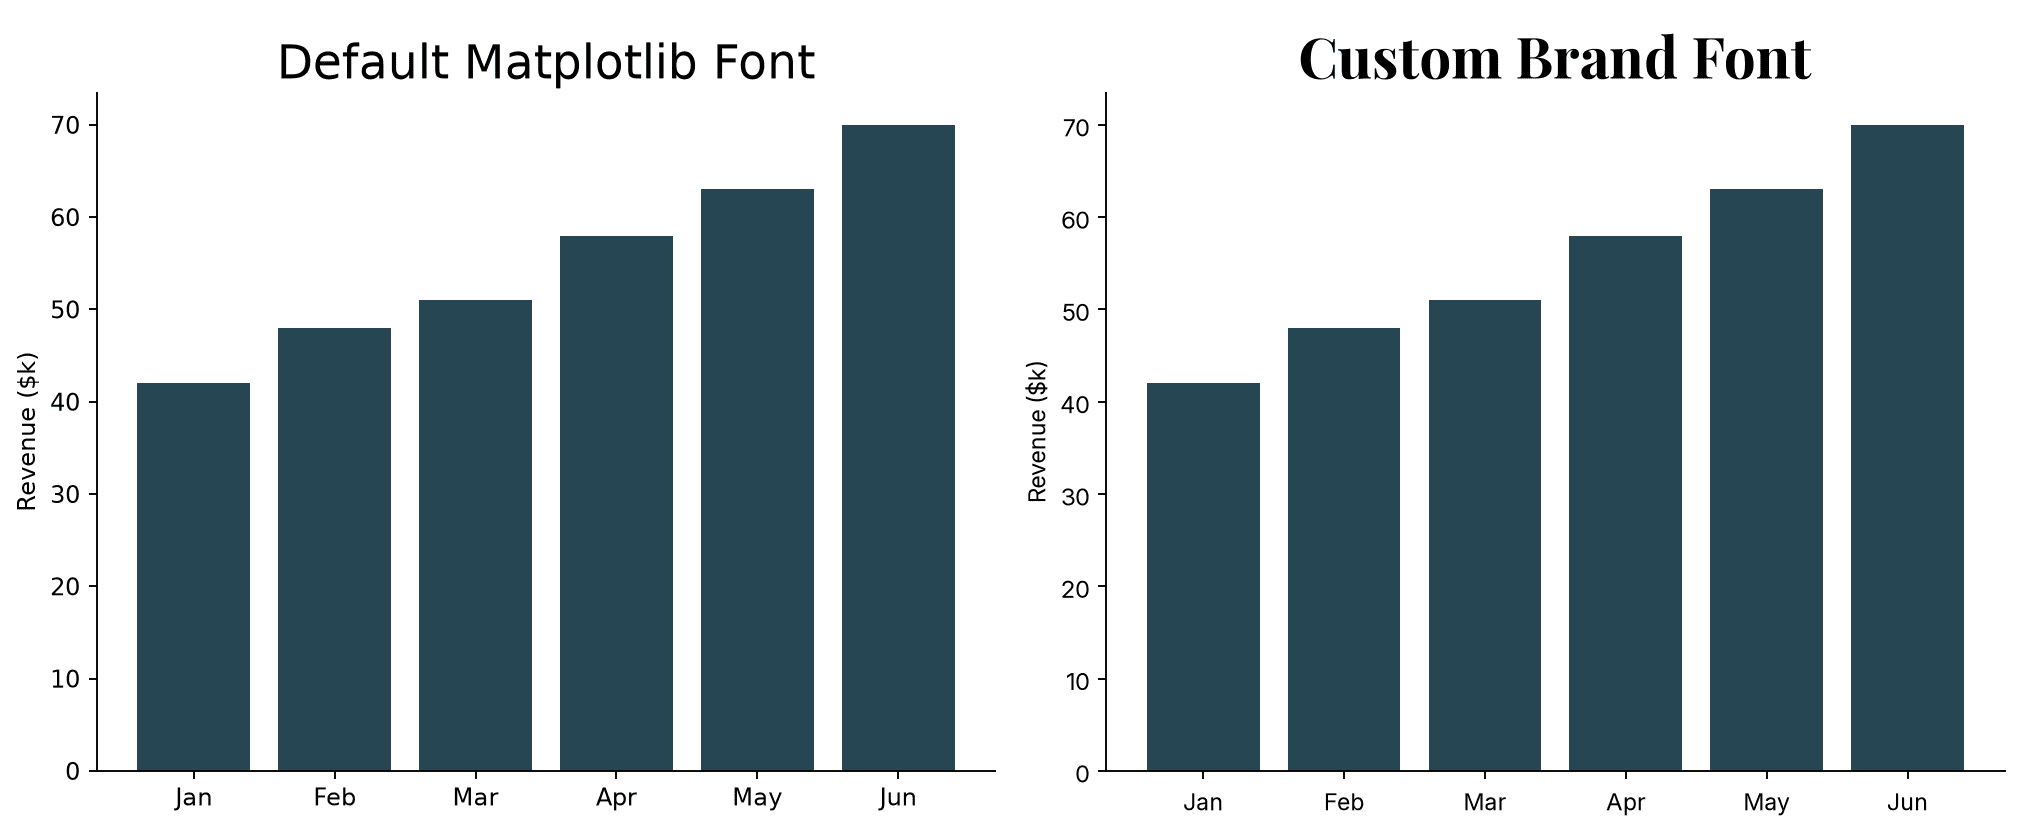
addfont() makes the font file available to Matplotlib's font manager for the rest of the session; it doesn't apply it anywhere on its own. Setting plt.rcParams["font.family"] afterward is what actually switches every subsequent chart over to that font.
Getting the correct font name
The single most common mistake here is passing the filename, or the name shown on the Google Fonts website, into font.family. Matplotlib needs the font's internal name, which is embedded in the font file itself and doesn't always match either of those.
font_name = fm.FontProperties(fname="PlayfairDisplay-Bold.ttf").get_name()
print(font_name)  # e.g. "Playfair Display", not the filename
FontProperties(fname=...).get_name() reads that internal name directly out of the file, which is the reliable way to get the exact string font.family expects, rather than guessing at it from the filename or downloaded folder name.
Mixing a heading font with a body font
Setting font.family globally applies one font to the entire chart. For a heading font paired with a separate body font, a common brand typography pattern, pass a FontProperties object directly to individual text elements instead.
heading_font = fm.FontProperties(fname="PlayfairDisplay-Bold.ttf")
body_font = fm.FontProperties(fname="Inter-Regular.ttf")

ax.set_title("Q2 Team Performance", fontproperties=heading_font, fontsize=22)
ax.set_ylabel("Score", fontproperties=body_font, fontsize=12)

for label in ax.get_xticklabels() + ax.get_yticklabels():
    label.set_fontproperties(body_font)
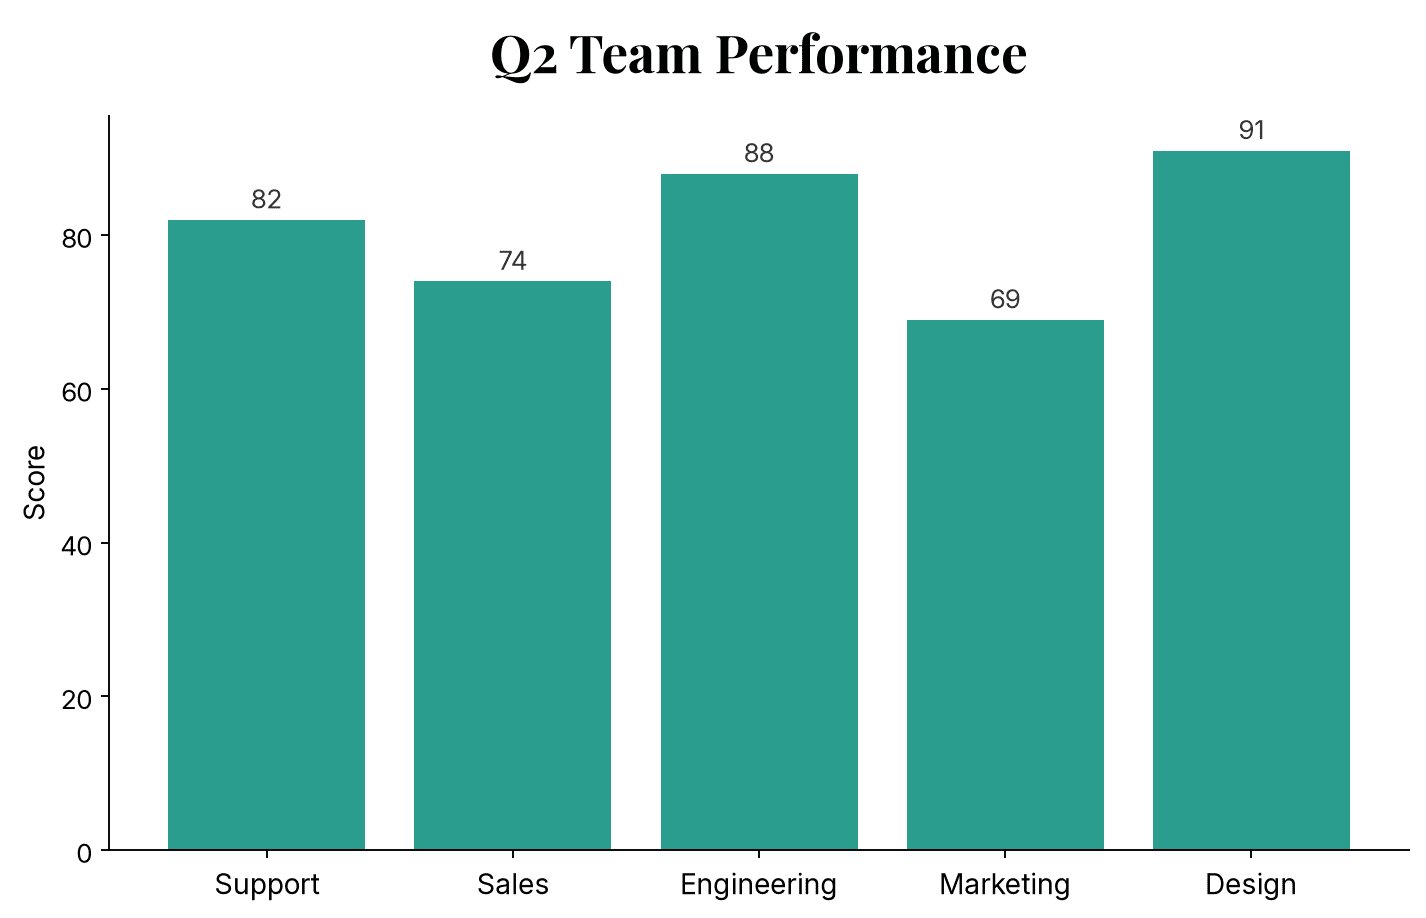
fontproperties on an individual call (set_title(), set_ylabel(), ax.text()) overrides the global font.family for that one element only, which is what makes a two-font layout possible without switching the rc setting back and forth mid-chart.
Two gotchas that both look like "the font just isn't applying"
Wrong name, silent fallback. Get the font name wrong, and Matplotlib doesn't raise an error. It prints a quiet findfont warning to the console and silently falls back to the default font, which is easy to miss if you're not watching stderr.
plt.rcParams["font.family"] = "PlayfairDisplay-Bold"  # wrong: this is a filename, not the internal name
# Console: findfont: Font family 'PlayfairDisplay-Bold' not found.
Setting rcParams too late. This one is sneakier: rcParams["font.family"] only affects text created after it's set. A title or label created before the change keeps whatever font was active when it was created, even if you change rcParams and re-render the figure afterward.
fig, ax = plt.subplots()          # title/axis Text objects are created here
plt.rcParams["font.family"] = font_name   # too late for this figure
ax.set_title("My Chart")          # still picks up the family that was active
                                    # when `ax` itself was created, not this line
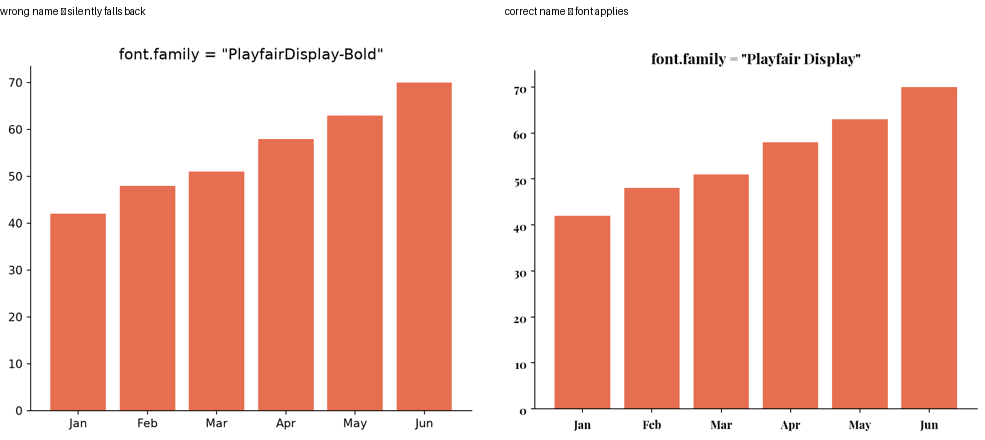
The fix for the second gotcha is to set rcParams["font.family"] before calling plt.subplots() (or any other figure-creating call), not after. If two figures need two different fonts in the same script, that means building them as two fully separate plt.subplots() calls, each with the rcParam set immediately beforehand, rather than reusing one figure and changing the rcParam in between. This is also the strongest argument for preferring the fontproperties= approach from the previous section over global rcParams mutation: an explicit FontProperties object passed directly to set_title() has no creation-order dependency to get wrong.
If a custom font "isn't working" and the chart still looks like the default, check the console for a findfont warning first, and if there isn't one, check whether rcParams was set before or after the figure was created.
Practical Tips
- Always get the font's real internal name with
FontProperties(fname=path).get_name()rather than typing it in by hand; the filename and the Google Fonts display name frequently don't match it exactly. addfont()only needs to run once per session (or once per script); it doesn't need to be called again before every plot.- Watch the console for
findfont: Font family '...' not foundwarnings; this is Matplotlib's only signal that a font name didn't resolve, and it still renders a chart, just with the wrong font. - Set
rcParams["font.family"]before creating the figure (plt.subplots()), not after; text elements keep whatever font was active at their own creation time, regardless of later rcParams changes. - Use
fontproperties=on individual text calls for a two-font layout (heading vs. body); reserveplt.rcParams["font.family"]for when the whole chart should use one font. - Bold and italic variants are usually separate font files (e.g.
Inter-Bold.ttf,Inter-Italic.ttf); register and reference each one individually rather than expecting Matplotlib to synthesize bold or italic from a single regular-weight file.