
Seaborn
Overlaying a Scatter (Swarm) Plot on top of a Box Plot in Seaborn
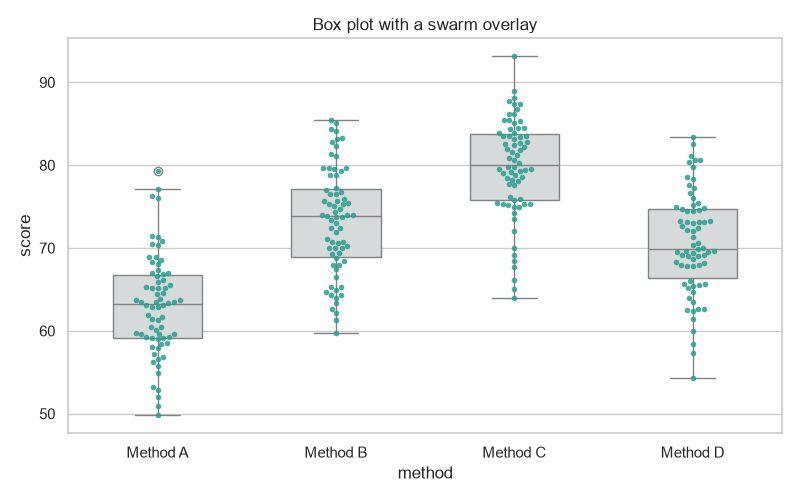
Overlay a swarm (scatter) plot on a Seaborn box plot to show every point alongside the summary.
Overlay a swarm (scatter) plot on a Seaborn box plot to show every point alongside the summary.
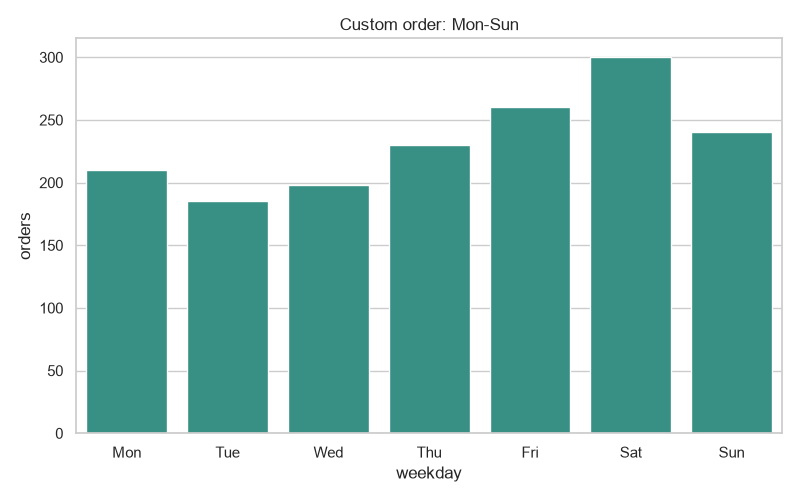
Control the x-axis category order in Seaborn with order=, CategoricalDtype, and hue_order.