
Seaborn
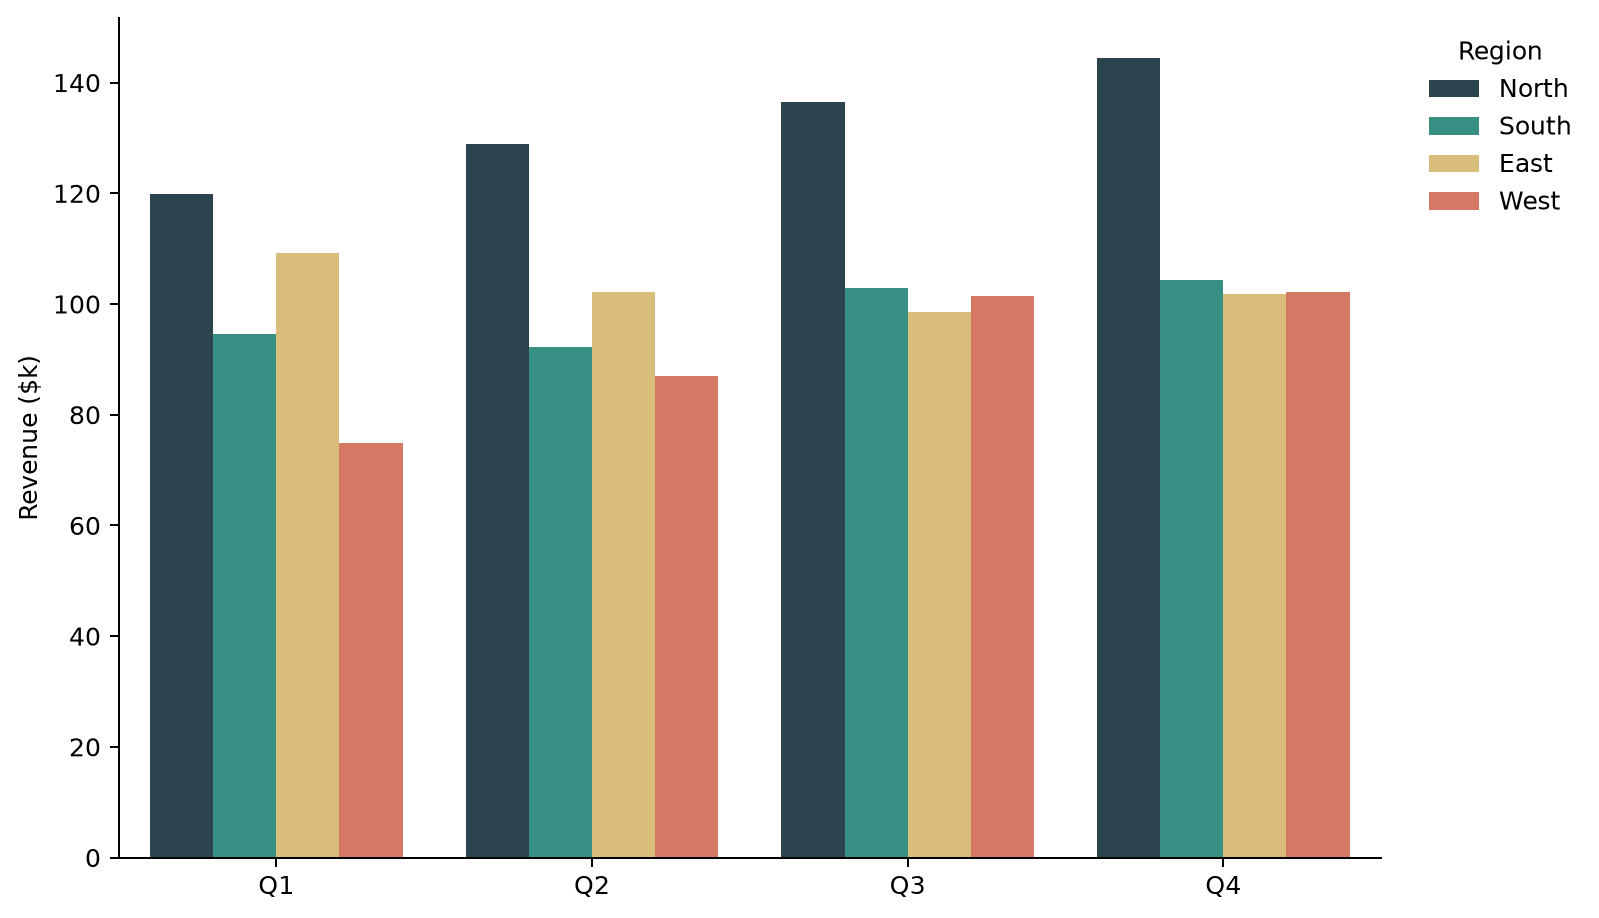
How to Plot Grouped Bar Charts with Seaborn
Plot grouped bar charts in Seaborn using hue, control group order, spacing, and orientation.
Plot grouped bar charts in Seaborn using hue, control group order, spacing, and orientation.
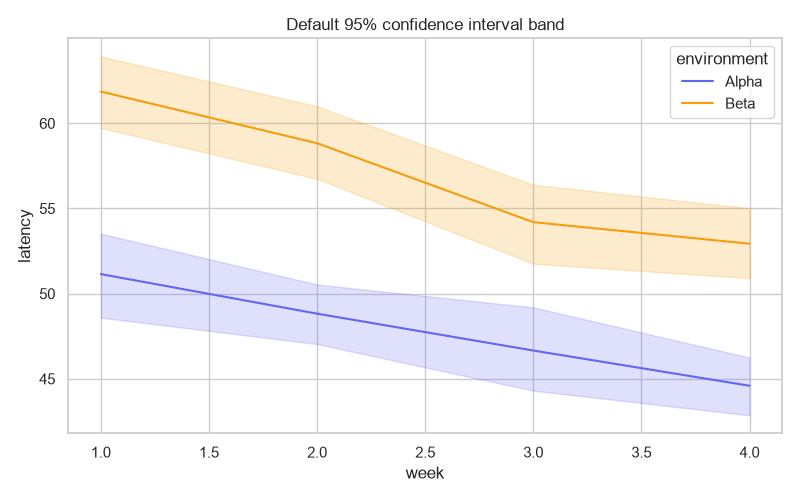
Create, modify, and remove confidence interval bands in Seaborn with the errorbar parameter.
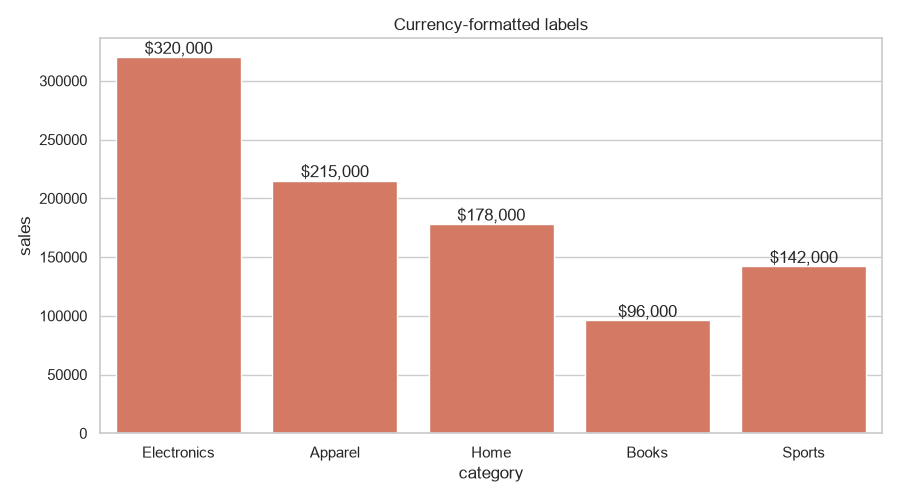
Add data values on top of Seaborn bar plots with ax.bar_label and custom formatting.
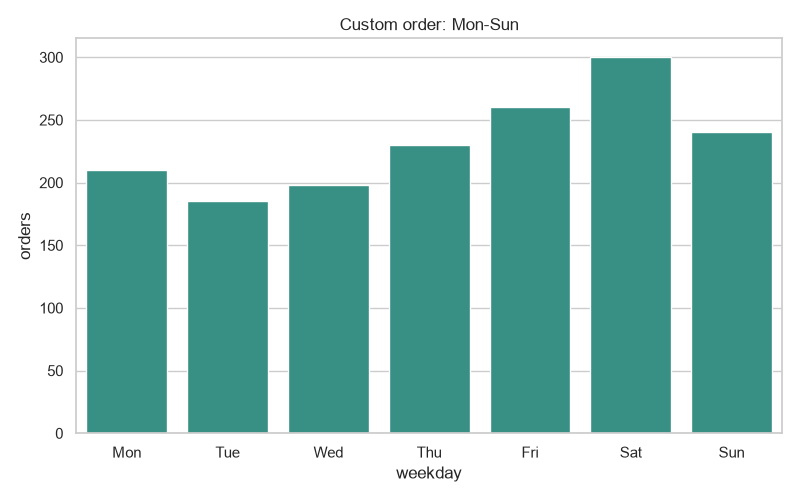
Control the x-axis category order in Seaborn with order=, CategoricalDtype, and hue_order.