
Pandas
How to Plot Secondary Y-Axis in Pandas
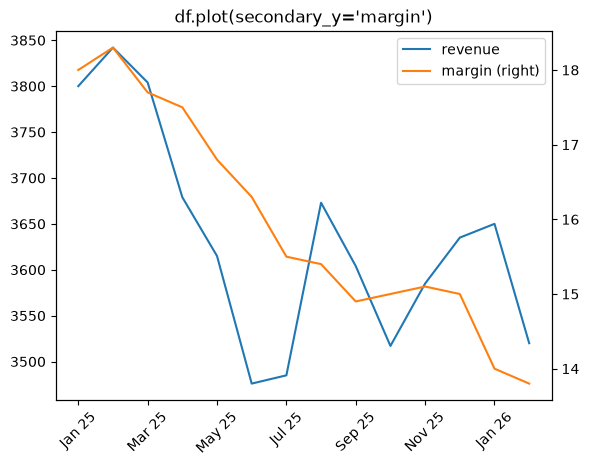
Plot a secondary y-axis in Pandas with df.plot(secondary_y=...) or ax.twinx().
Plot a secondary y-axis in Pandas with df.plot(secondary_y=...) or ax.twinx().
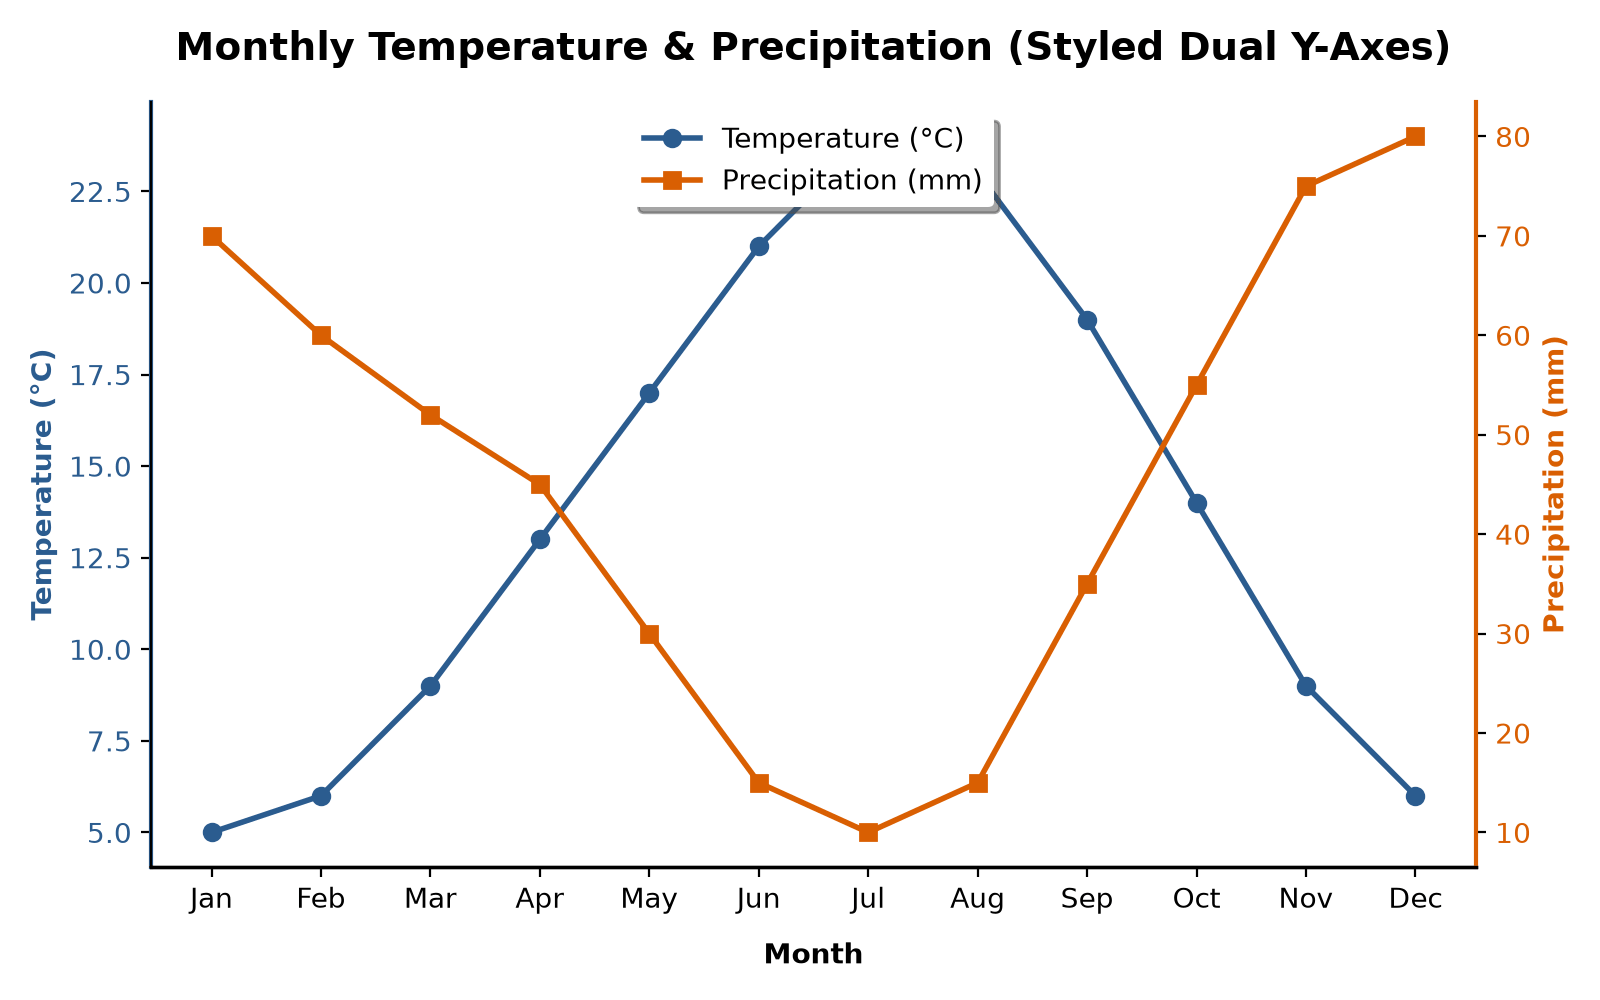
Learn how to use ax.twinx() to plot two datasets with different scales on a shared X-axis.